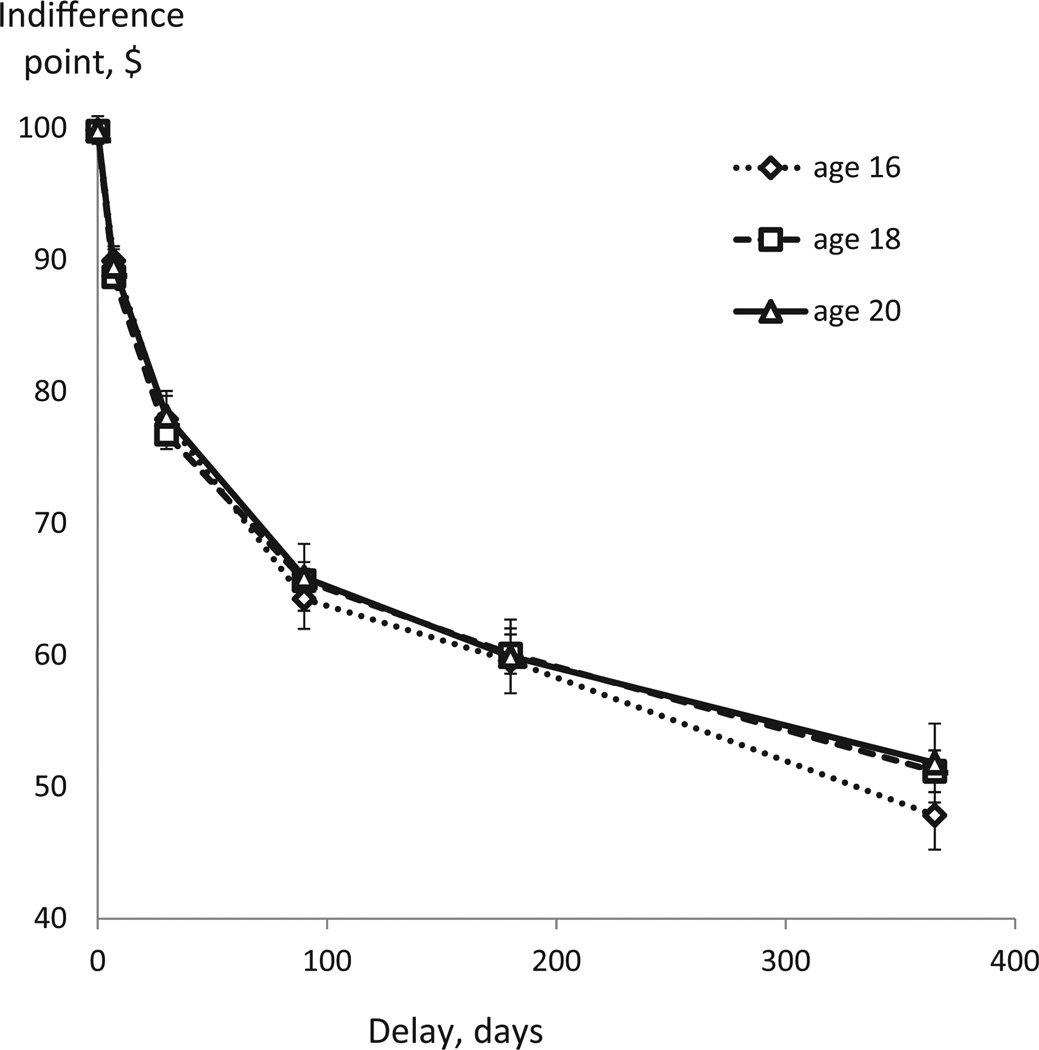
Figure 1.
Discounting of $100 amount as a function of delay to its receipt. Average data at each age (16, 18, 20) are presented. Horizontal axis: delay in days; line markers indicate delays of 0, 7, 30, 90, 180, and 365 days. Vertical axis: Indifference points, or subjective value of the $100 amount at each of the delays.

