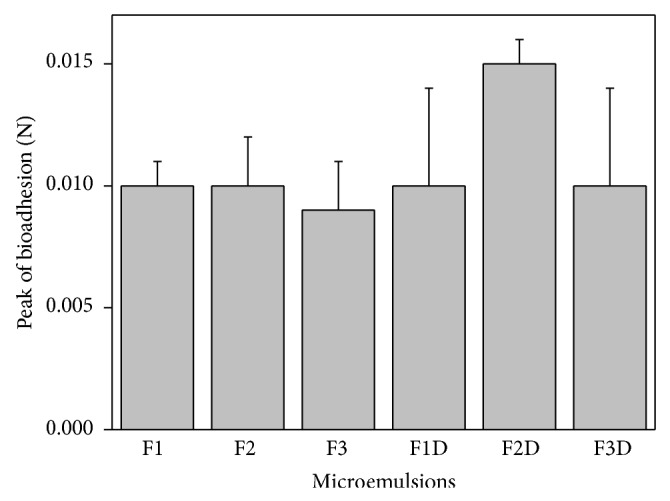
Figure 4.

Peak of bioadhesion (N) of FLU-unloaded MEs (F1, F2, and F3) and FLU-loaded MEs (F1D, F2D, and F3D). Each value represents the mean (± standard deviation) of at least seven replicates. Data were collected at 32 ± 0.5°C. No statistically significant difference was detected.
