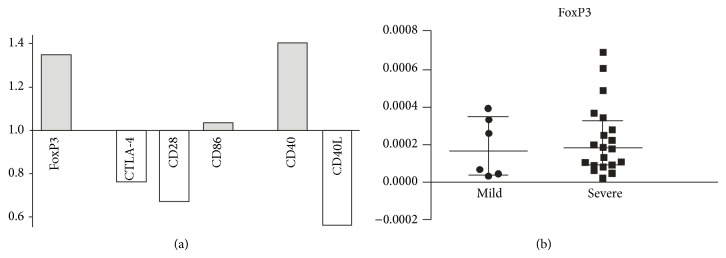
Figure 4.

(a) Quantitative RT-PCR validation of the mRNA expression changes for assessed molecules in the severe GO compared to mild GO samples. The values above “1.0” on the y-axis show the relatively higher expression in the severe versus mild GO samples and values below “1.0” indicate relatively lower expression. (b) The individual data from RT-PCR displaying the expression of mRNA for transcription factor FoxP3 in severe GO and mild GO samples (medians and 25th–75th percentiles).
