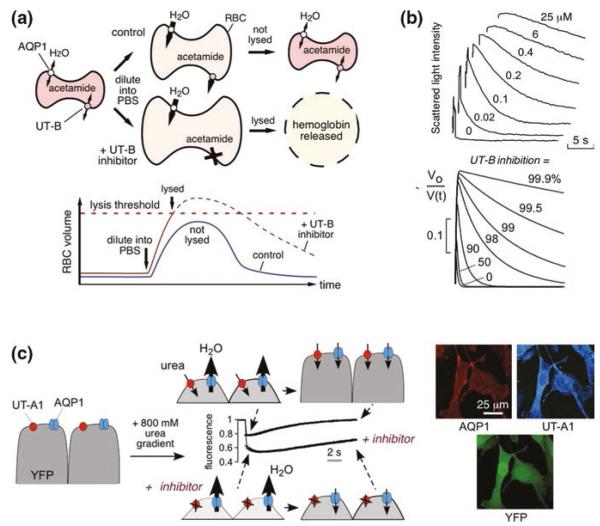
Fig. 11.1.
Assays for high-throughput identification of small-molecule UT inhibitors. a Erythrocyte osmotic lysis assay for UT-B inhibitor discovery. Erythrocytes expressing water and urea channels (AQP1 and UT-B) are preloaded with the urea analog acetamide. Following replacement of the external buffer with urea/acetamide-free isomolar solution, water entry results in cell swelling, which is limited by UT-B-mediated urea/acetamide efflux. Under optimized assay conditions, UT-B-facilitated urea/acetamide prevents osmotic lysis, whereas UT-B inhibition impairs urea/acetamide exit resulting in substantial lysis. (Bottom) Biphasic cell volume changes in the lysis assay. Increased erythrocyte volume beyond a threshold results in lysis. The dashed curve shows the hypothetical time course of erythrocyte volume if lysis had not occurred. b (Top) Stopped-flow measurements of urea transport in human erythrocytes. Concentration–inhibition curves for indicated compounds determined by light scattering in response to a 100 mM inwardly directed urea gradient. (Bottom) Numerically simulated inhibitor concentration dependence used to determine IC50 from stopped-flow experiments. The inverse of normalized cell volume, Vo/V(t), is plotted to approximate light scattering data at indicated percentages of urea transport inhibition. c (Left) Assay for UT-A1 inhibitors. MDCK cells stably expressing UT-A1, AQP1, and YFP-H148Q/V163S were subjected to an 800 mM inwardly directed urea gradient. A rapid decrease in cell volume (reduced fluorescence) due to the water efflux through AQP1 is followed by cell reswelling (increased fluorescence) due to urea and water influx. The UT-A1 inhibitor phloretin alters curve shape. (Right) UT-A1 and AQP1 immunofluorescence of the triply transfected cells, shown with YFP fluorescence. Adapted from [5, 16]

