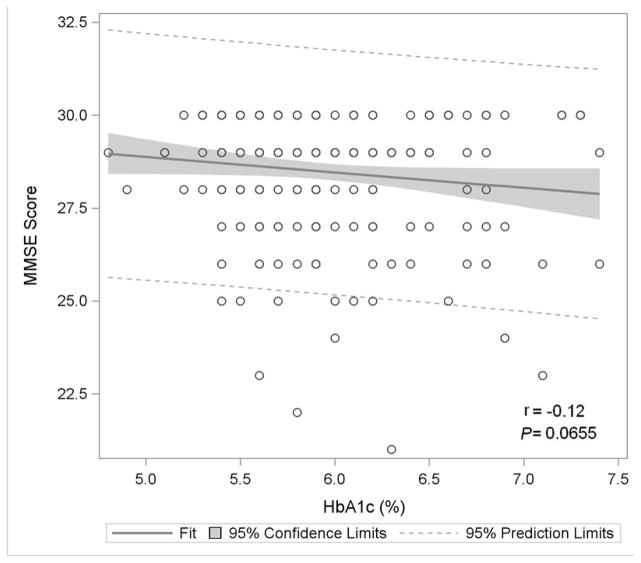
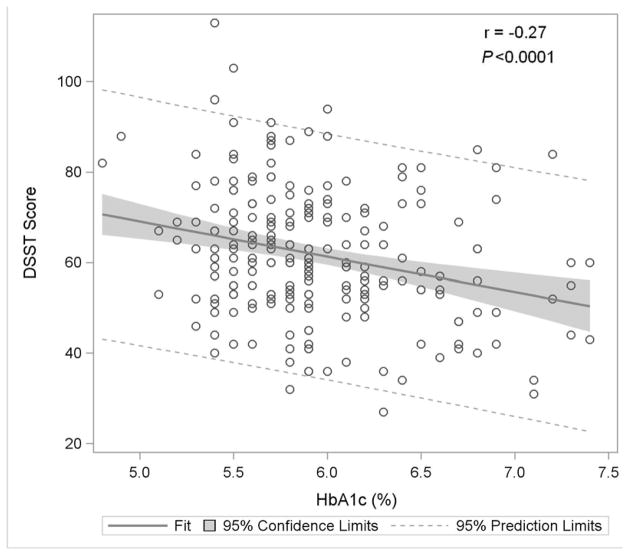
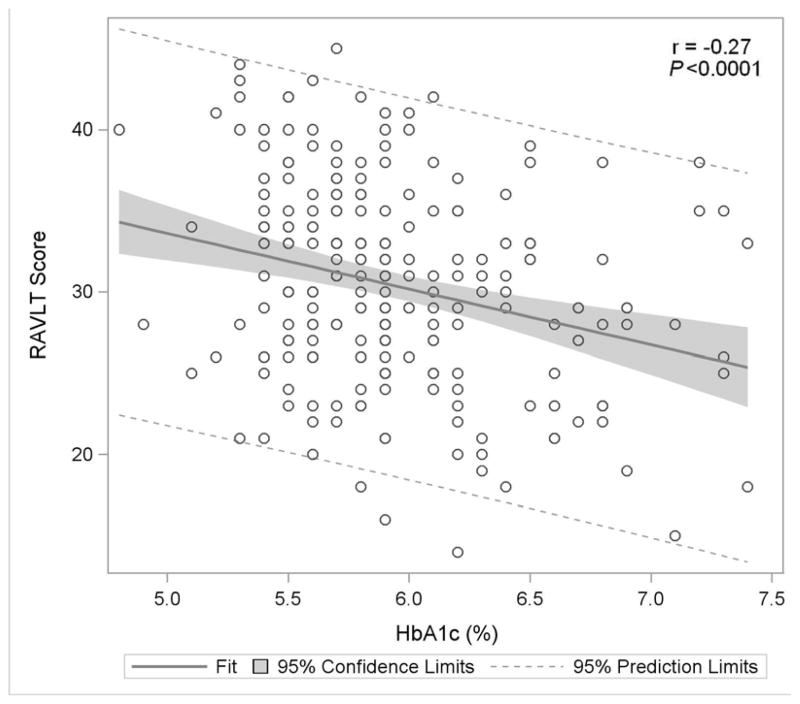
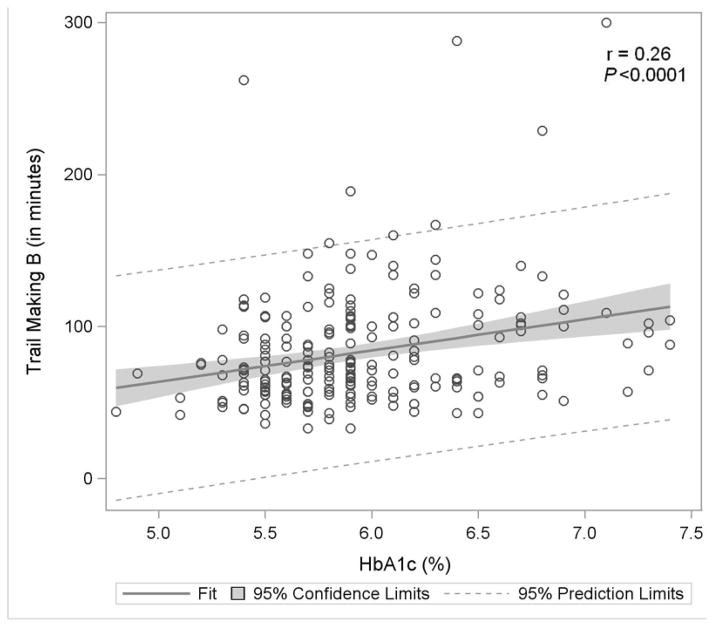
Figure 1. Association of Glycemia with Measures of Cognitive Function.
Figure 1A: Mini-Mental State Exam
Figure 1B: Digit Symbol Substitution Test
Figure 1C: Rey Auditory Verbal Learning Test
Figure 1D: Trail Making Test B
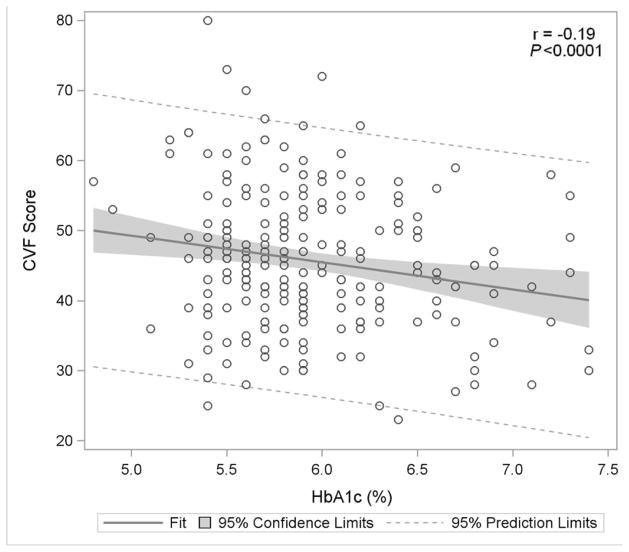
Figure 1E: Categorical Verbal Fluency
Figure 1 displays in the full study cohort population scatterplots showing correlation, fitted regression, and 95% confidence intervals relating Hemoglobin A1c and cognitive function tests [A] Displays the fit plot for regression of Mini-mental state examination (MMSE) and Hemoglobin A1c (HbA1c). There is no association between HbA1c and Mini-Mental State Examination score (P=0.07). [B] Displays the fit plot regression for Digit Symbol Substitution Test (DSST) and HbA1c. The average DSST score of a patient changes by β̂ =−7.79 units for each unit change in HbA1c (r=−0.27, P<0.0001), [C] Displays the fit plot for regression of Rey Auditory Verbal Learning Test (RAVLT) and HbA1c. The average RAVLT score of a patient changes by β̂= −3.44 units for each unit change in HbA1c (r=−0.27, P <0.0001). [D] Displays the fit plot for regression of Trail Making B and HbA1c, The average Trail Making B score of a patient changes by β̂=20.6 units for each unit change in HbA1c (r=0.27, P<0.0001) and [E] Displays the fit plot for regression of Categorical Verbal Fluency (CVF) and HbA1c. The average CVF score of a patient changes by β̂= −3.82 units for each unit change in HbA1c (r=−0.19, P=0.0042). To convert HbA1c: HbA1c(%) = [0.09148 * HbA1c (mmol/mol)] + 2.152.

