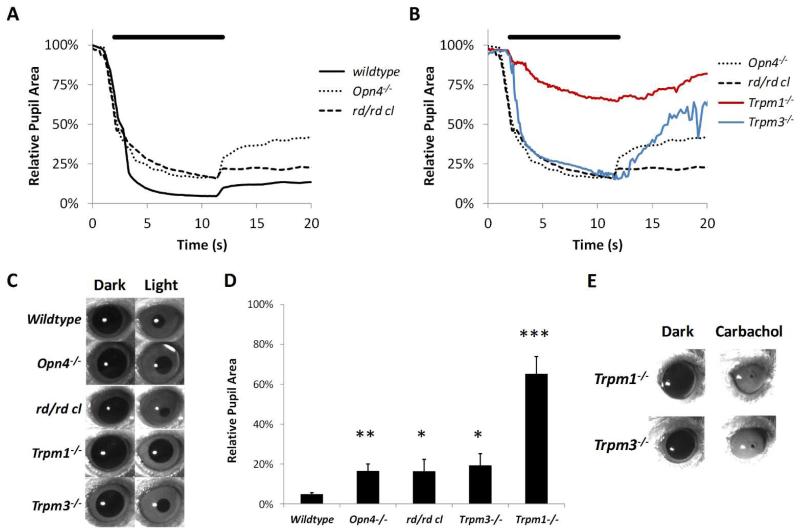
Figure 2.
Analysis of the pupillary light response (PLR) in Trpm1−/− and Trpm3−/− mice. (A) Pupil constriction profiles recorded from normal wildtype, Opn4 −/− and rd/rd cl mice in response to bright light illumination (480nm, 14.6 log quanta/cm2/s). (B) Pupil constriction profiles recorded from Trpm1−/− and Trpm3−/− mice in response to bright light illumination (14.6 log quanta/cm2/s). Responses from Opn4−/− and rd/rd cl mice are plotted for comparison. Light stimuli from 2-12 seconds (black bar above traces). Profiles shown are mean of responses from n=3-6 mice. (C) Representative images of pupil size recorded before and after bright light stimulation. (D) Graph shows the maximal pupil constriction observed following bright light exposure. * = p<0.05, **=P<0.01, ***=P<0.001. (E) Images of pupil size observed for Trpm1−/− and Trpm3−/− mice before and after application of 1M carbachol.

