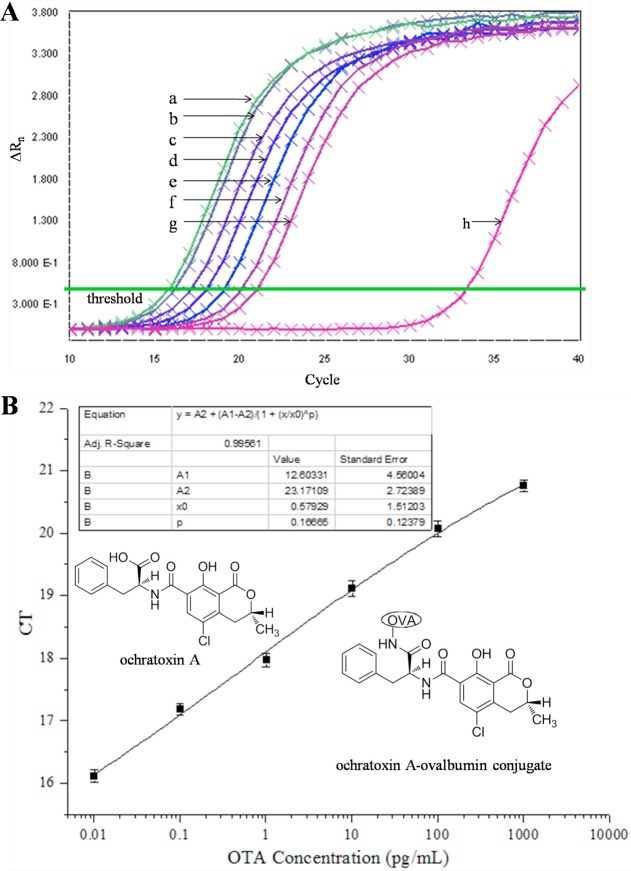
Figure 4.
VHH phage-based competitive RT-IPCR assay of OTA. (A) OTA amplification curves of VHH phage-based competitive RT-IPCR assay. Curves b–g represent serial 10-fold dilutions of OTA from 0.01 to 1000 pg/mL. Curves a and h are the negative control (no OTA) and blank control (no VHH phage), respectively. (B) OTA standard curve.

