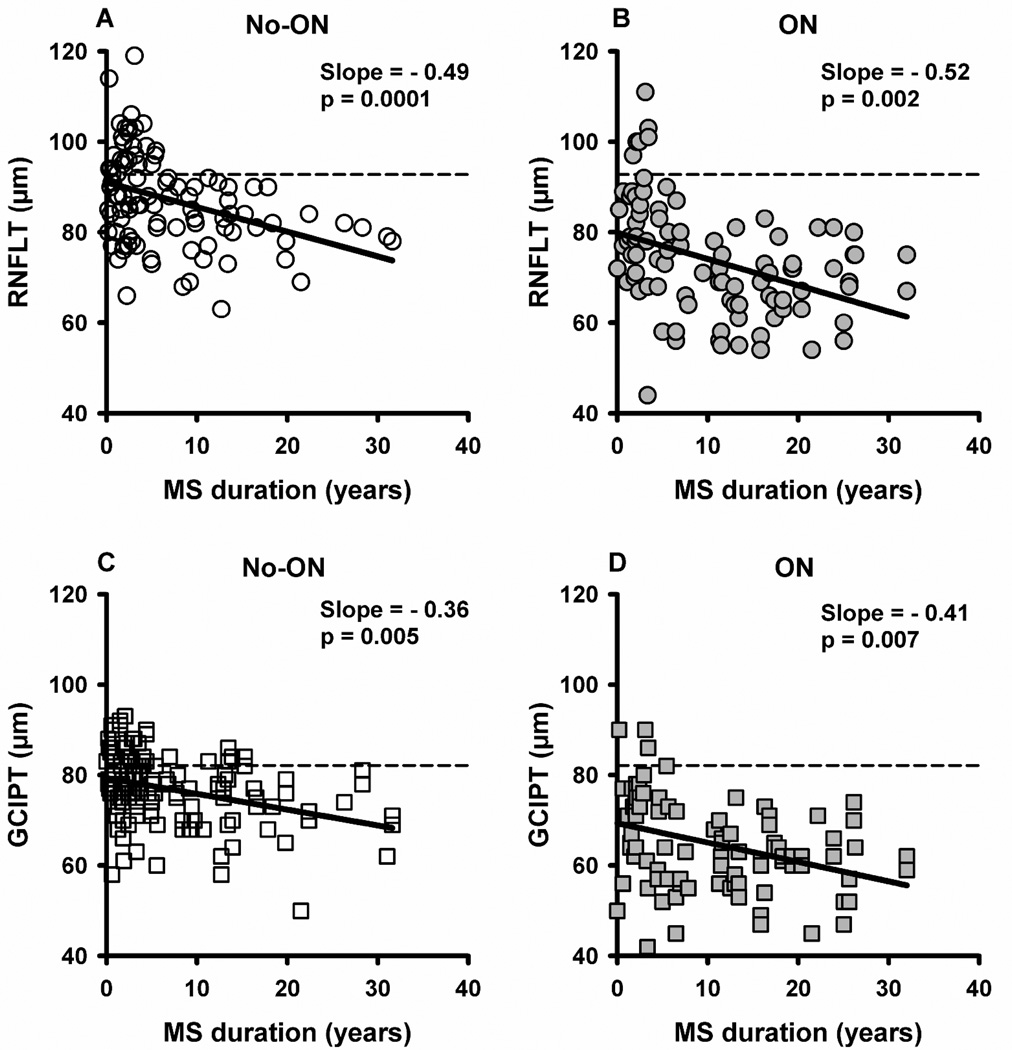
Figure 1.
Scatter plot showing RNFLT vs MS duration (A and B) and GCIPT vs MS duration (C and D) for individual no-ON and ON eyes. Each symbol (circles for RNFLT and squares for GCIPT) represents an individual eye of a patient. Open symbols represent no-ON and filled symbols represent ON eyes. The solid lines are the fitted linear regression lines (GEE models). The dashed lines are the average reported normative values for a cohort between 18 and 84 years of age.9

