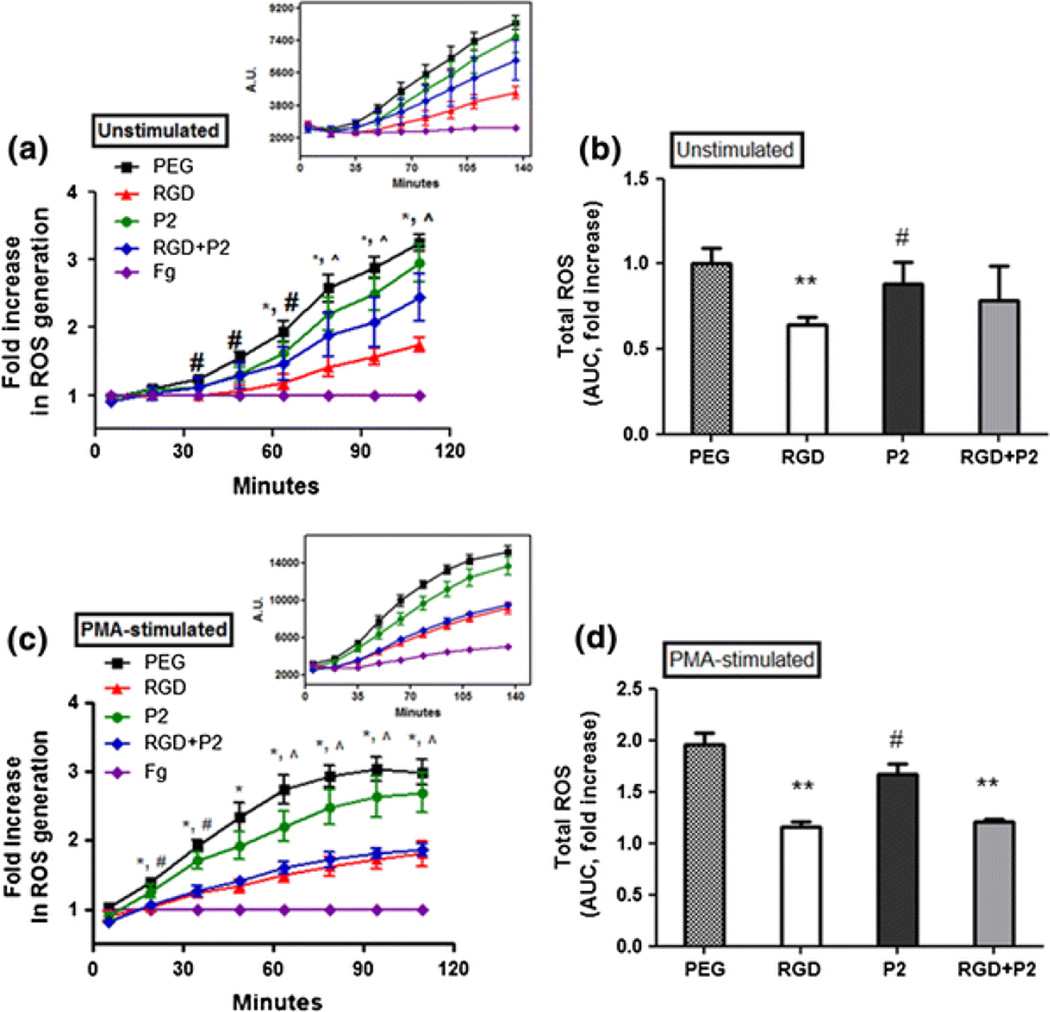
Figure 2.
Integrin-mediated ROS suppression of neutrophils. Integrin-mediated ROS generations were evaluated by measuring fluorescent oxidation product of H2TMRos (λex/λem = 544/590 nm). ROS production from (a) unstimulated and (c) PMA-stimulated neutrophils on fibrinogen, PEG, RGD, P2, and RGD+P2 modified hydrogels. ±SE of >three independent experiments. *Difference between cells on RGD and PEG, p < 0.05, #Difference between cells on P2 and PEG, p < 0.05, ^Difference between cells on RGD+P2 and PEG, p < 0.05. (b) and (d) reflect total ROS suppression from the area AUC relative to the total ROS detected from neutrophils on PEG. Values represent the means of triplicates. **Difference when compared with cells on PEG, p < 0.01, #Difference when compared with cells on RGD, p < 0.05

