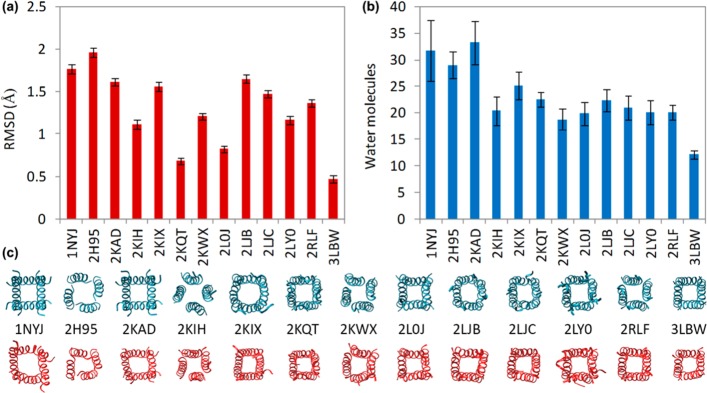
Figure 1.

Averages over the last 2 ns of three 6 ns simulations with light backbone constraints, here using the CHARMM27 force field. Each M2 channel’s (a) average protein-backbone RMSD of residues 26–43 from model 1 of its PDB structure, (b) average water content between residues 27–41, and (c) initial/final trajectory frames are shown. The end-view snapshots of the initial (blue) and final (red) structures below demonstrate the relative stability of the tilted helix bundle. Side views better show the variations between PDB models,56 but the end-view was chosen here to demonstrate the volume of the central cavities.
