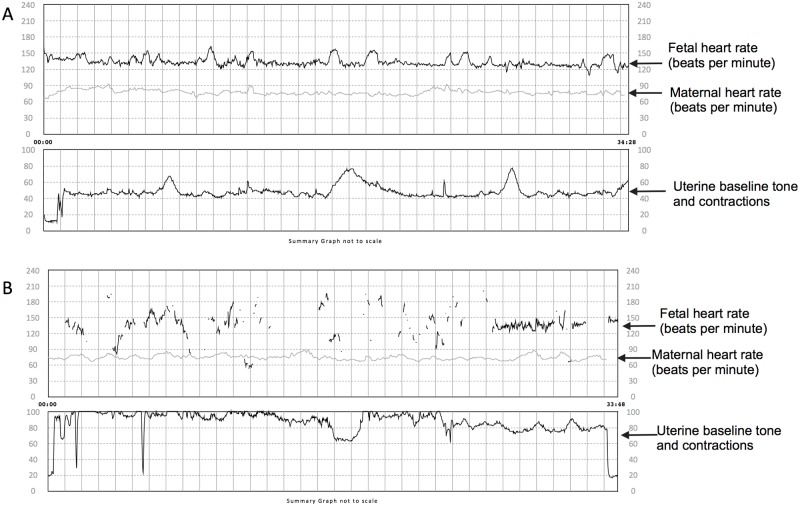
Fig 4. Examples of cardiotocographs obtained with the prototype technology.
Panels A and B show (from top to bottom) fetal heart rate, maternal heart rate, uterine tone and contractions. The fetal cardiotocograph in panel A received a mean score of 5 on readability. The fetal heart rate depicted is continuous with no breaks and loss of contact allowing easy interpretation of the baseline heart rate and to assess for increases and decreases in heart rate. Panel B shows a fetal cardiotocograph that received a mean score of 1.7. Here lack of a continuous heart rate tracing prevents interpretation of the fetal heart rate at all times. For example it is hard to distinguish if gaps in the tracing represent decreases, increases or no change in the baseline fetal heart rate.

