
Figure 3.
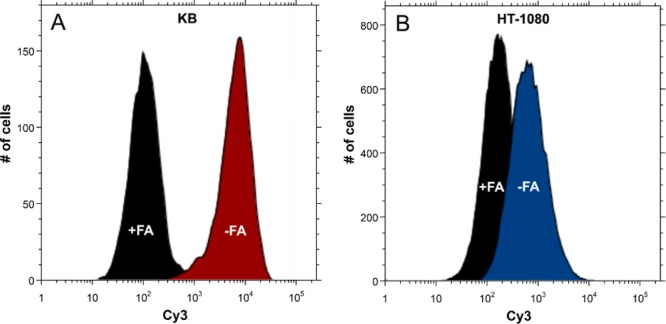
Flow cytometry quantified cell uptake of 4 μM Cy3-labeled 25. Uptake in (A) KB (FR+, red) and (B) HT-1080 (FR-, blue) cells was compared to cells inhibited by folic acid (black).
Official websites use .gov
A
.gov website belongs to an official
government organization in the United States.
Secure .gov websites use HTTPS
A lock (
) or https:// means you've safely
connected to the .gov website. Share sensitive
information only on official, secure websites.
Flow cytometry quantified cell uptake of 4 μM Cy3-labeled 25. Uptake in (A) KB (FR+, red) and (B) HT-1080 (FR-, blue) cells was compared to cells inhibited by folic acid (black).