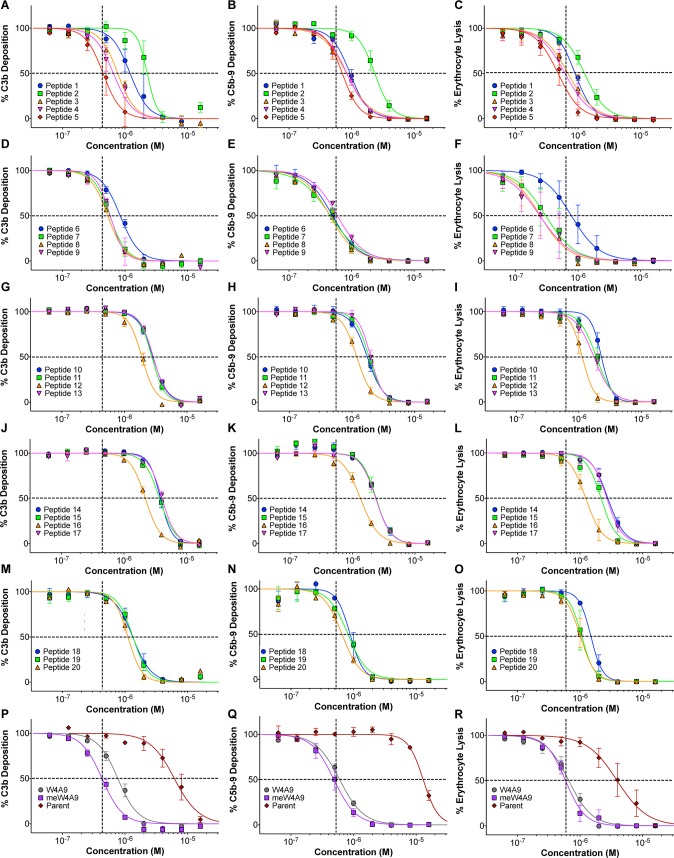
Figure 2.
Concentration-dependent inhibition curves of compstatin peptides in C3b and C5b-9 ELISAs and hemolytic assays. Data show C3b, C5b-9, and hemolysis inhibition (from left to right) for set 1 (A–C), set 2 (D–F), set 3 (G–I), set 4 (J–L), set 5 (M–O), and control (P–R) peptides. Data points indicate mean percent inhibition ± SEM (standard error of the mean). The intersection of dashed lines shows the IC50 value for meW4A9 in all plots. Curves to the right and left of the intersection point represent peptides with higher IC50 values and lower IC50 values compared to meW4A9, respectively.

