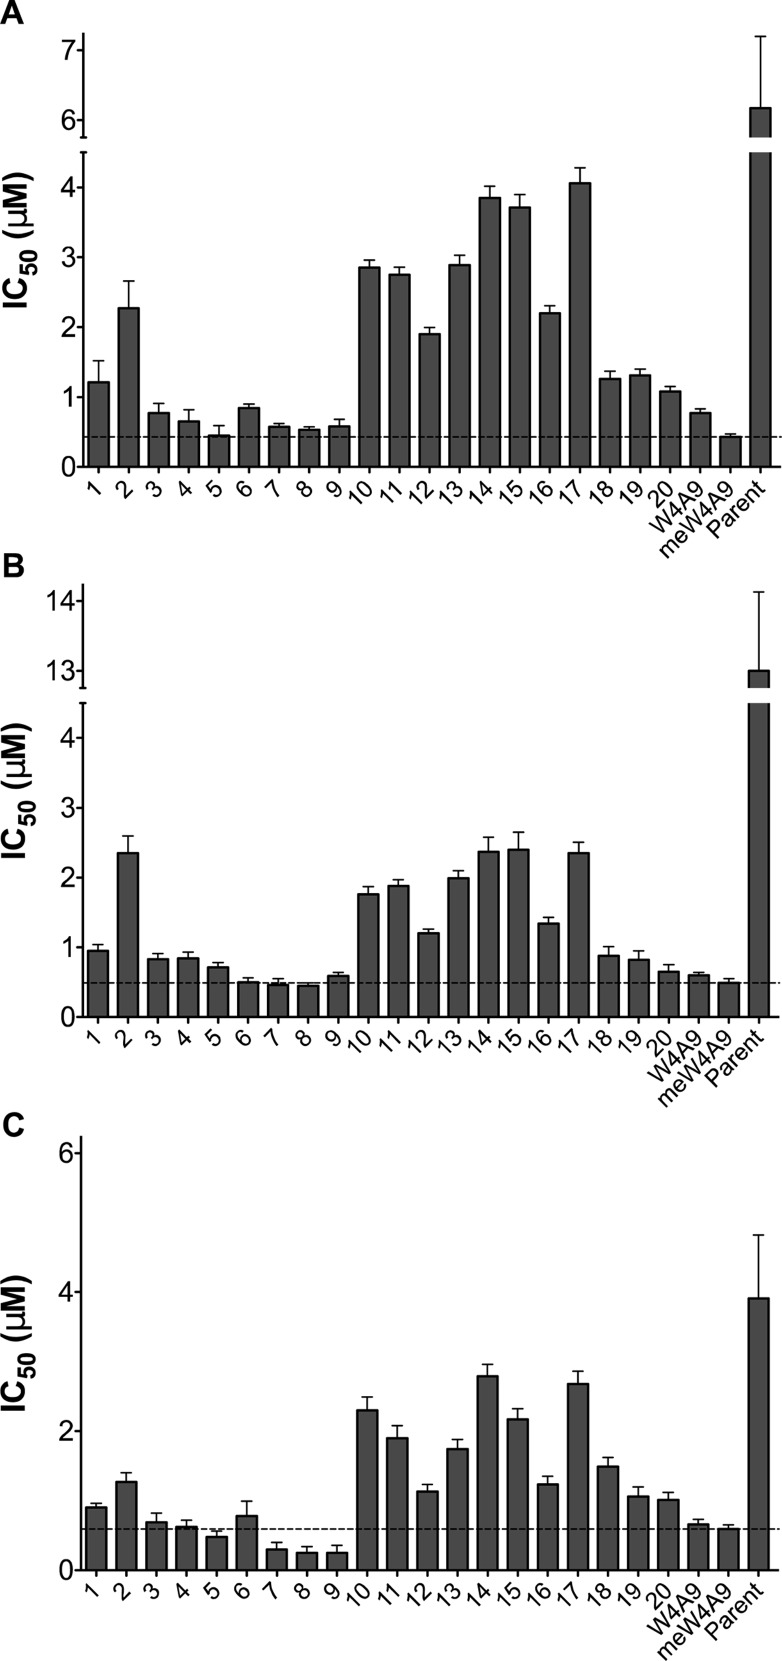
Figure 3.
IC50 values for compstatin peptides. Bar plots show IC50 values for compstatin peptides 1–20 and positive control peptides W4A9, meW4A9, and Parent in C3b ELISA (A), C5b-9 ELISA (B), and hemolytic assay (C). Bars show mean IC50 from three independent runs of each experiment (±95% confidence interval). The dashed horizontal line shows the IC50 value for the meW4A9 control peptide, for ease of comparison.

