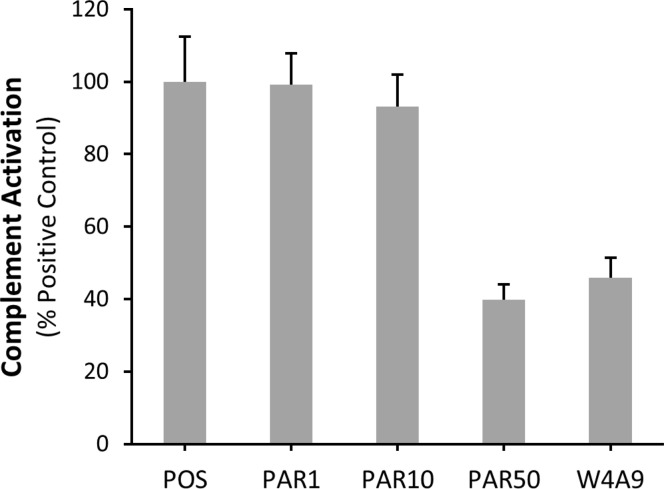
Figure 5.
Effects of varying concentrations of Parent on complement activation in the RPE cell in vitro assay. The ratio of C5b-9/ApoE fluorescence (±SEM, n = 10) is plotted as a percentage of the positive control. Parent was tested at concentrations of 1, 10, and 50 μM (PAR1, PAR10, and PAR50). The concentration of W4A9 was 1 μM. All values are expressed relative to the positive control. Parent shows no significant difference from the positive control at 1 μM or 10 μM concentrations. At 50 μM the effect of Parent is equivalent to that of 1 μM W4A9. Both Parent at 50 μM and W4A9 at 1 μM are significantly different than the positive control (p-value of <0.001, two-tailed Mann–Whitney U test).

