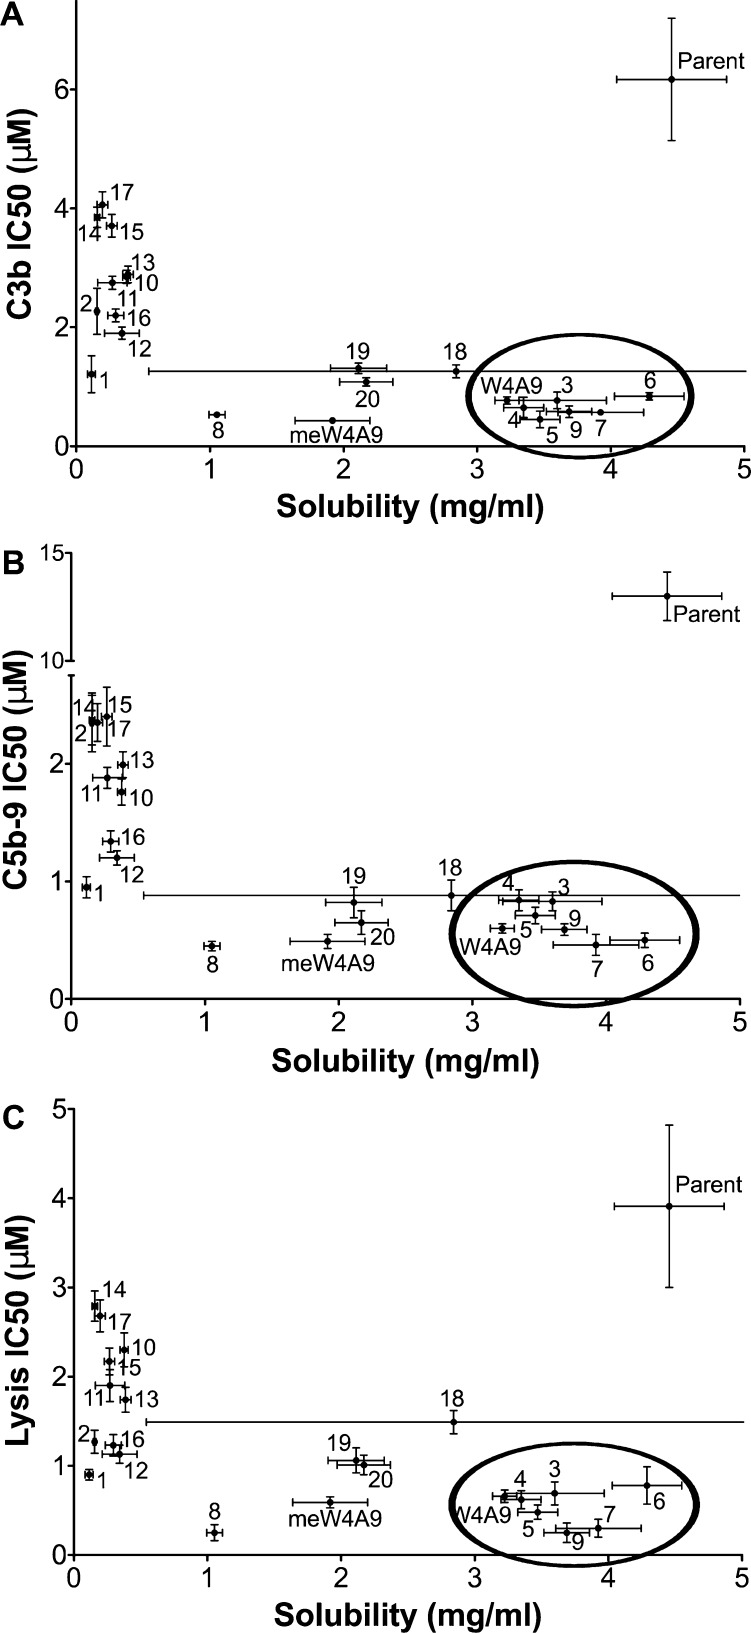
Figure 6.
Relation between activity and solubility of compstatin peptides. IC50 values for compstatin peptides in C3b ELISA (A), C5b-9 ELISA (B), and hemolytic assay (C) are plotted against solubility. Horizontal and vertical error bars represent the standard deviation and 95% confidence intervals of solubility and IC50, respectively. Points inside the ellipse (lower right corner) have a favorable balance between activity and solubility. Note the peptide 8 solubility was measured using less starting material compared to the rest, and thus, its solubility is not directly comparable to that of other peptides.

