
Figure 2.
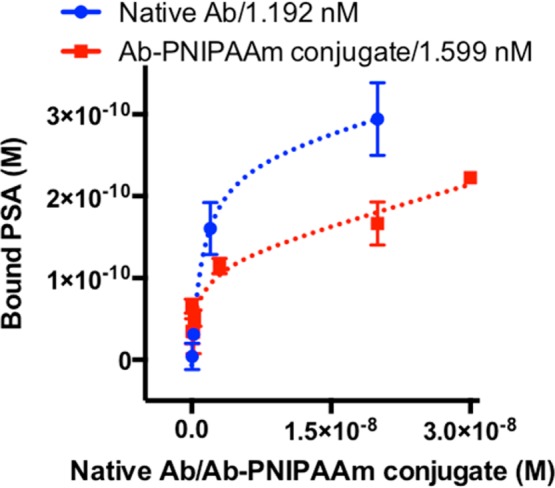
Equilibrium binding curves for native Ab (blue) and Ab-PNIPAAm conjugate (red). Error bars are standard deviations over three independent experiments. Dashed lines are fittings via one site total binding model, which was also used to estimate KD values (GraphPad Prism). The native Ab (blue) KD is 1.192 nM, and the KD for Ab-PNIPAAm conjugates (red) is 1.599 nM.