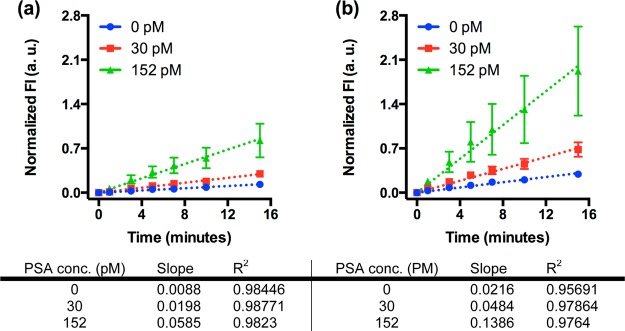
Figure 4.

Results of immunoassays with larger specimen volume. The fluorescence intensity increased with time for each antigen concentration measured. Increasing the volume of sample loaded from (a) 2.5 μL to (b) 7.5 μL resulted in a modest increase in the rate of production for the null sample, while antigen containing sample increased significantly, thus decreasing the limit of detection. Dashed lines are linear fits to the data and error bars are standard deviations over three independent experiments. Data points are for 0, 1, 3, 5, 7, 10, and 15 min only.
