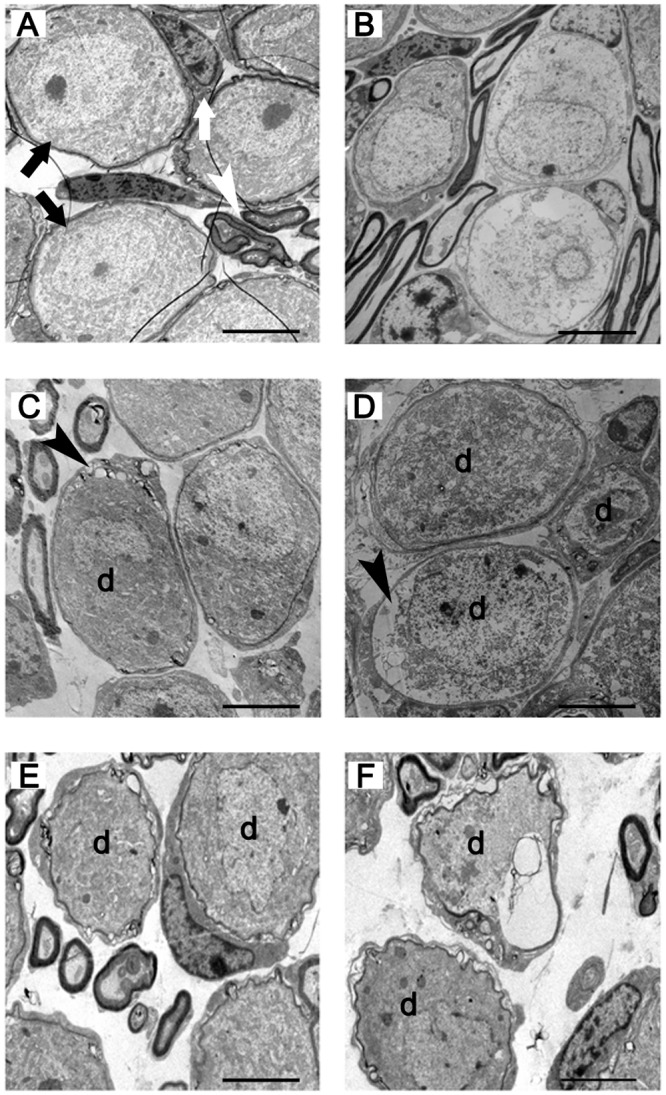
Fig 5. Transmission electron micrograph of the SGCs taken from the basal turns of the cochleae in the animals treated with kanamycin and furosemide.

A: The SGCs in the cochlea from the control group. B: The SGCs in the experiment group 1 day following the end of drug administration. Compared with the control group, no abnormal changes occurred. C: The 5th-day experiment group. The abnormal changes of SGCs appeared. In the SGCs, cytoplasmic vacuoles gathered at the edge of the cytoplasm, with a few swelling and scattered mitochondria and vague nucleoli. D: The 15th-day experiment group. SGC degeneration was progressive. E: The 30th-day experiment group. SGC degeneration was further aggravated. Balloon-like and vacuole-like spaces appeared around the perikarya of SGCs. Abnormal, partially collapsed or folded myelin sheaths were seen. F: The 60th-day experiment group. SGC degeneration was more severe. Black arrow: spiral ganglion cells; white arrow: Schwann cell; white arrowhead: myelinated nerve fibers; black arrowhead: cytoplasmic vacuoles; d: degenerated spiral ganglion neurons. Scale bar = 5μm.
