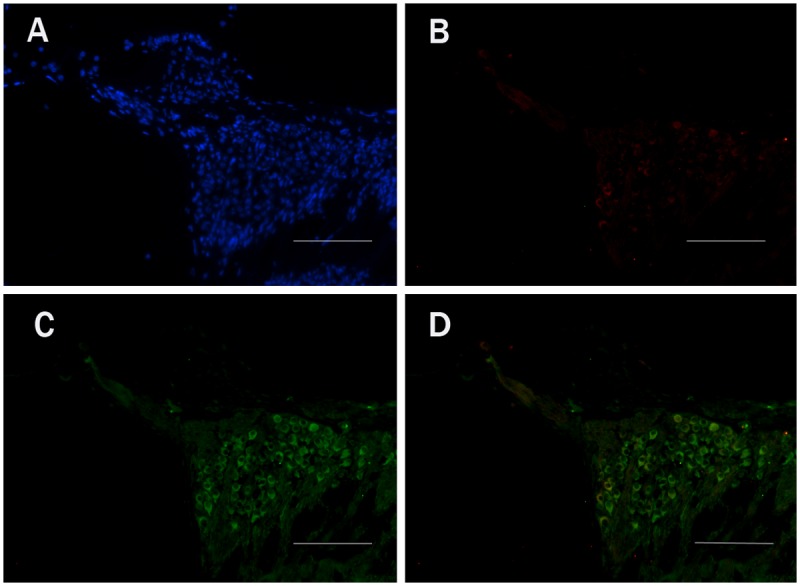
Fig 6. Fluorescent immunohistochemistry images of EFR3A expression in the basal turns of cochlea from the control group.

A: DAPI staining. B: anti-EFR3A staining. C: TUJ1 staining. D: Co-labeling images of TUJ1 and EFR3A. It showed that EFR3A was localized predominantly in the SGCs of the cochlea. Scale bar = 50μm.
