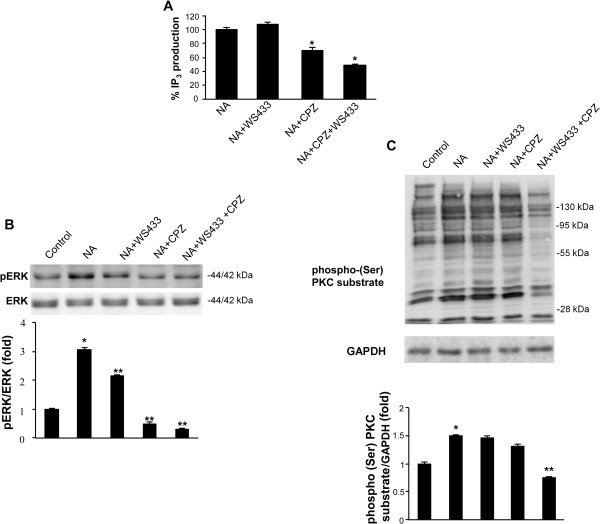
Figure 5.

Role of TRPV1 and α1D -AR in NA-induced PLC, PKC and ERK activation. (A) The IP3 levels, measured as above described, were evaluated in PC3 cells treated for 5 min with NA (100 μM), either alone or in combination with CPZ (1 μM), WS433 (1 μM) or CPZ + WS433. Data shown are the mean ± SD of three separate experiments. Statistical analysis was performed by comparing NA + WS433-, NA + CPZ- or NA + CPZ + WS433- with NA-treated cells, *p ≤ 0.01. (B-C) Lysates from PC3 cells vehicle-treated (control) or treated for 3 min with NA (100 μM) alone or in combination with WS433 (1 μM) and/or CPZ (1 μM), were separated on SDS-polyacrylamide gels, transferred and then blotted with anti-pERK, ERK and anti-phospho-(Ser) PKC substrate Abs. The GAPDH protein level was evaluated as a loading control. Data shown are representative of one out of three separate experiments. Densitometric analysis was performed evaluating three different experiments and statistical analysis was performed by comparing NA-treated cells with control cells (*) and NA + WS433-, NA + CPZ- and NA + WS433 + CPZ- with NA-treated cells (**), p ≤ 0.01.
