FIGURE 4.

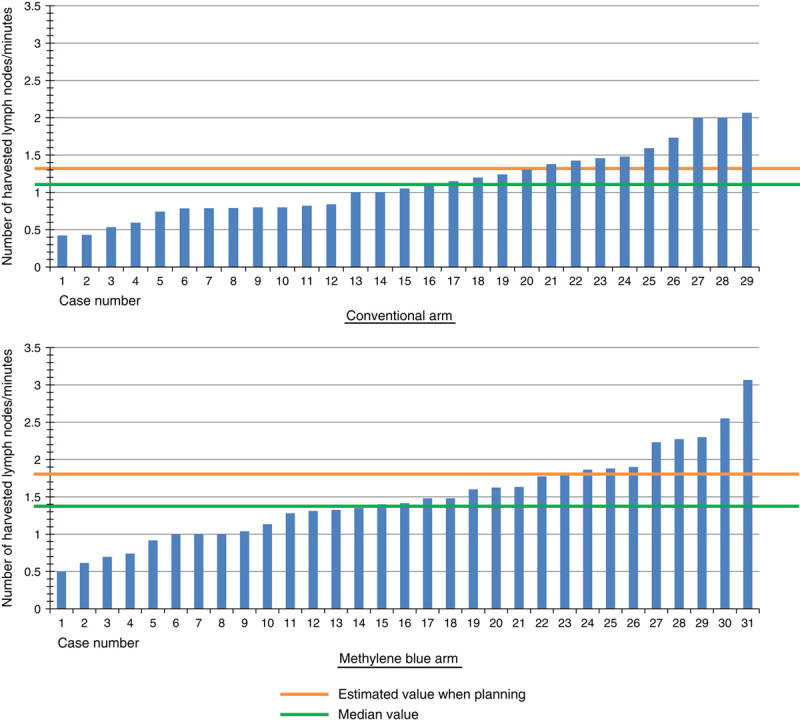
A waterfall plot of the number of harvested LNs per time (in minutes) in the conventional and methylene blue arms. The orange line indicates the estimated value determined when planning the study. The green line indicates the median value.

A waterfall plot of the number of harvested LNs per time (in minutes) in the conventional and methylene blue arms. The orange line indicates the estimated value determined when planning the study. The green line indicates the median value.