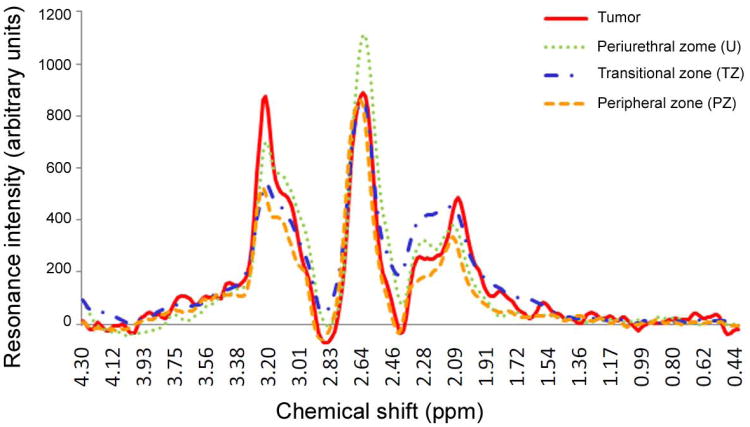
Fig. 1.
Averaged spectra from different prostate zones. The curves were derived from 129 cancerous spectra; 1139 peripheral zone spectra (> 50% peripheral zone within the voxel); 1457 transition zone spectra (> 50% transition zone within the voxel); and 389 periurethral zone spectra (>= 10% periurethral tissue within the voxel). While the most characteristic marker of prostate cancer on MRSI is an elevated choline signal at 3.21 ppm, elevated choline is also observed in the normal periurethral region. The averaged spectra illustrate the difficulty of correctly classifying the voxels close to the urethra and suggest that anatomical segmentation may be helpful for distinguishing the periurethral spectra from cancerous spectra. Cancer tissue spectra also reveal a relatively elevated peak at 2.06 ppm, which is likely to be spermine (38); however, this region is in the transition band of the spectral-spatial refocusing pulses (4).

