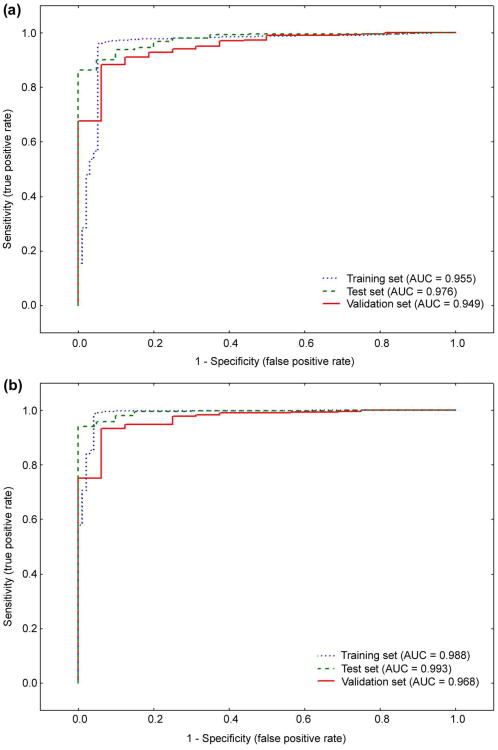
Fig. 4.
Receiver operating characteristic curves of the pattern recognition models for training, test and validation sets: (a) model 1, with only spectra as input; (b) model 2, using spectra and anatomical segmentation. The optimally performing models 1 and 2 were chosen out of one hundred automatically generated models of each kind, with the full dataset split into training, test and validation sets every time a new model is created. The legends indicate AUC for each dataset. Model 2 (b) has higher AUCs than model 1 (a) for each of the three datasets.

