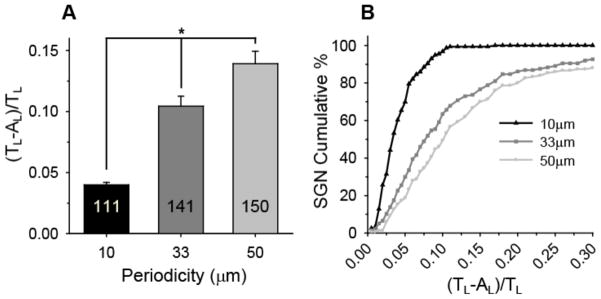
Figure 9.

SGN neurite alignment on patterns with constant amplitude (1 μm) but varying periodicity. A) SGN neurite alignment (mean±SE) increases significantly with decreasing periodicity (*p < 0.005, one way ANOVA). SGN neurite alignment was measured as a ratio of unaligned length per neurite length, [(TL−AL)/TL]. B) Representation of the cumulative percent of neurites at or below the alignment ratio indicated in the x-axis. 97% of the SGN neurite population cultured on patterns with a 10 μm periodicity falls within a low alignment ratio of 0.10 compared to 63% and 49% on patterns with 33 and 50 μm periodicities, respectively.
