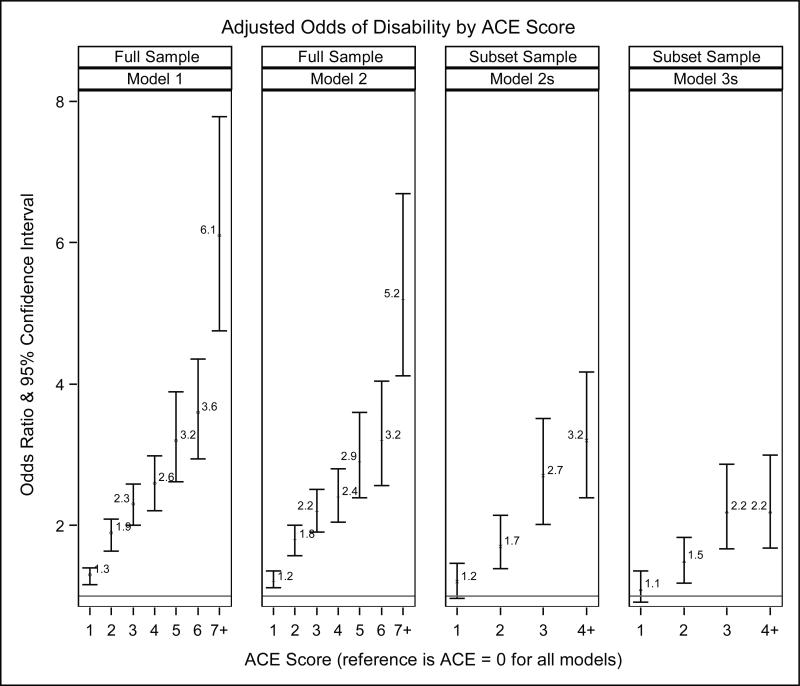
Figure 2. Odds of Disability by ACE Score (Counted number of ACE categories).
Model 1 is adjusted for demographics (age, sex, race/ethnicity, marital status, education, income) Model 2 is adjusted for demographics and physical health conditions (asthma, stroke, myocardial infarction, coronary heart disease, diabetes)
Model 2s is the same as model 2, but performed in the sample subset (n = 22,739) which answered the Anxiety/Depression module. It is needed as a baseline comparison to Model 3s in order to be able to understand how the addition of anxiety and depression changes the association between ACE and disability.
Model 3s adds anxiety and depression to the covariates adjusted for in Model 2s, allowing one to see how the association between ACE Score and disability changes with the inclusion of these covariates.

