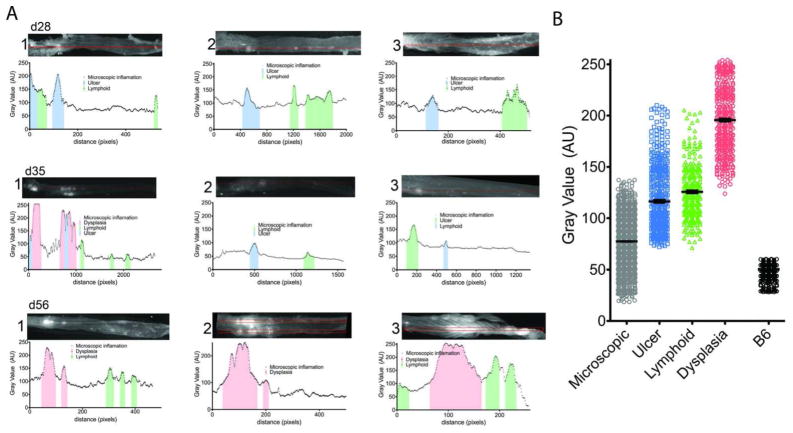
Figure 1. Emission patterns of colitis lesions in representative mice.
A) Representative patterns of three colons each from d28, d35 and d56 mice are shown. The patterns represent the emission values per pixel alongside a box 5 pixels x the length of the colon. The color shaded areas of the graphs represent verified areas of ulcers (blue), lymphoid aggregates (green) and dysplasia (red). On the top of each graph are the reflectance fluorescence images of each colon analyzed. (B) Cumulative plots of the emission values of each type of lesions analyzed: microscopic (gray), ulcer (blue), lymphoid aggregates (green), dysplastic lesions (red) and healthy B6 colon (black) are shown.

