
Fig. 3.
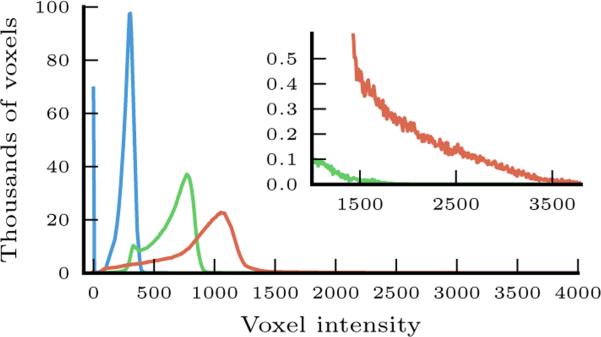
Voxel intensity histograms from three different patients (shown in three different colors), illustrating typical differences in intensity distributions within the approximate brain mask obtained via rigid registration from the atlas. The inset highlights the difference at the high end of intensity values.