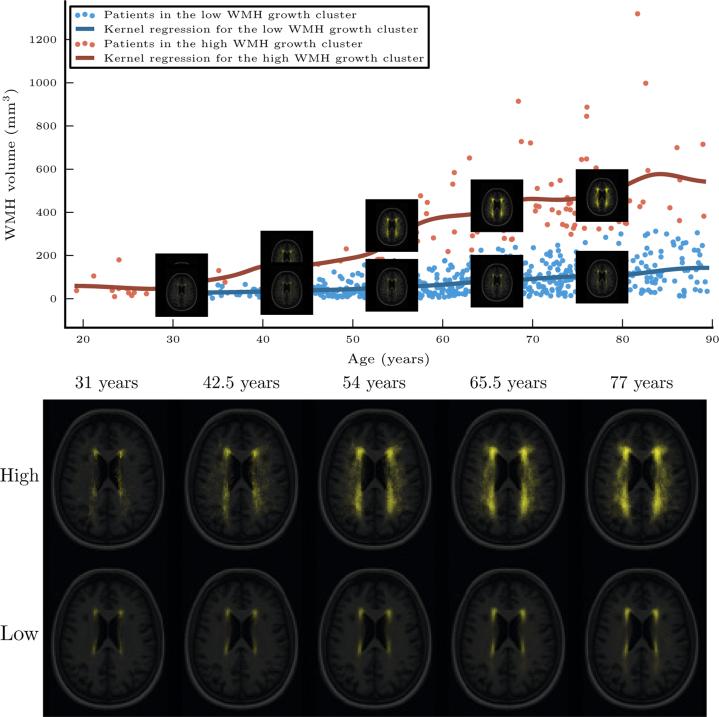
Fig. 6.
Top: the two-component regression mixture model clusters the patients into those with high WMH growth as a function of age (red) and those with low WMH growth as a function of age (blue). The lines show a kernel regression of WMH volume as a function of age in each cluster. The representative images shown are obtained via kernel regression of the WMH label maps as a function of age. Bottom: the two sets of representative images in more detail.

