
Figure 4.
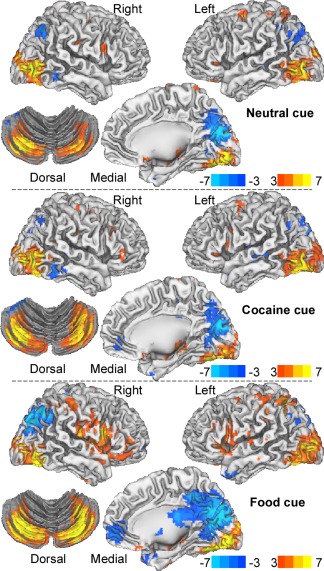
Statistical significance of brain activation (red‐yellow)/deactivation (blue‐cyan) responses to the cue videos relative to the fixation baseline epochs, rendered on lateral and ventral views of the cerebrum and a dorsal view of the cerebellum. [Color figure can be viewed in the online issue, which is available at http://wileyonlinelibrary.com.]