
Figure 8.
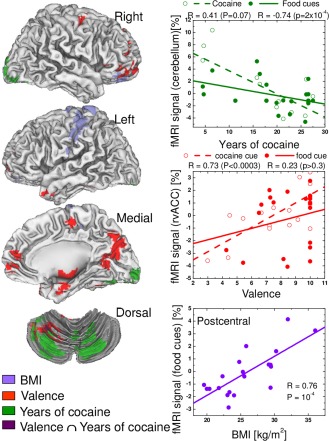
Correlation patterns between the average activation to cocaine and food cues and BMI, cue valence and years of cocaine use and their overlap (Valence ∩ Years of cocaine use), superimposed on lateral and ventral views of the cerebrum and a dorsal view of the cerebellum (left), as well as the corresponding linear regression plots showing the significant correlation of these variables (right). [Color figure can be viewed in the online issue, which is available at http://wileyonlinelibrary.com.]