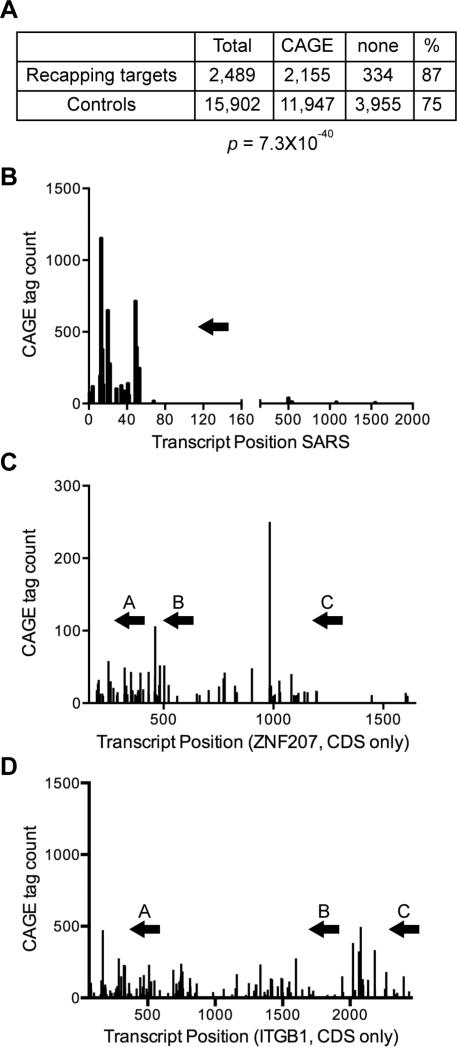
Figure 1. mRNA targets of cytoplasmic capping have a greater representation of downstream CAGE tags than non-target mRNAs.
A. The datasets of cytoplasmic capping targets and control transcripts from [7] and from the databases of K562 cells in Table 1 were compared using Fisher's Exact Test to determine the correlation between cytoplasmic capping targets and the presence of downstream CAGE tags within spliced exons. B-D. The positions and number of CAGE tags are shown across the length of the predominant isoforms of SARS (B), ZNF207 (C) and ITGB1 mRNA (D). The location of primers used for 5’-RACE are identified by arrows above the plots for each transcript.

