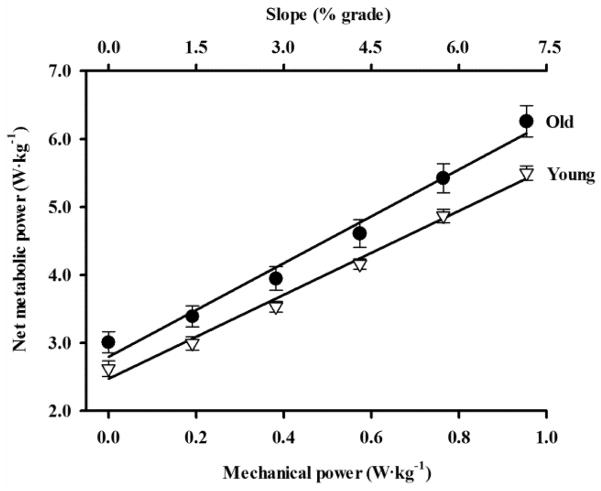
Figure 2.
Net metabolic power consumption versus uphill slope (top x-axis) and mechanical power output required to lift the body up the hill (bottom x-axis) for young adults (open triangles) and older adults (filled circles) (mean ± SEM). Net metabolic power consumption was significantly greater for older adults than for young adults at each slope (p < .05). Lines are least squares regressions (r2 = .99 for young and r2 = .98 for older). “Delta efficiency” is calculated from the inverse of the slope of the regression line representing the relationship between metabolic power and mechanical power. Delta efficiency was significantly lower in older adults (29%) compared to young adults (33%) across the range of uphill slopes (p = .006).

