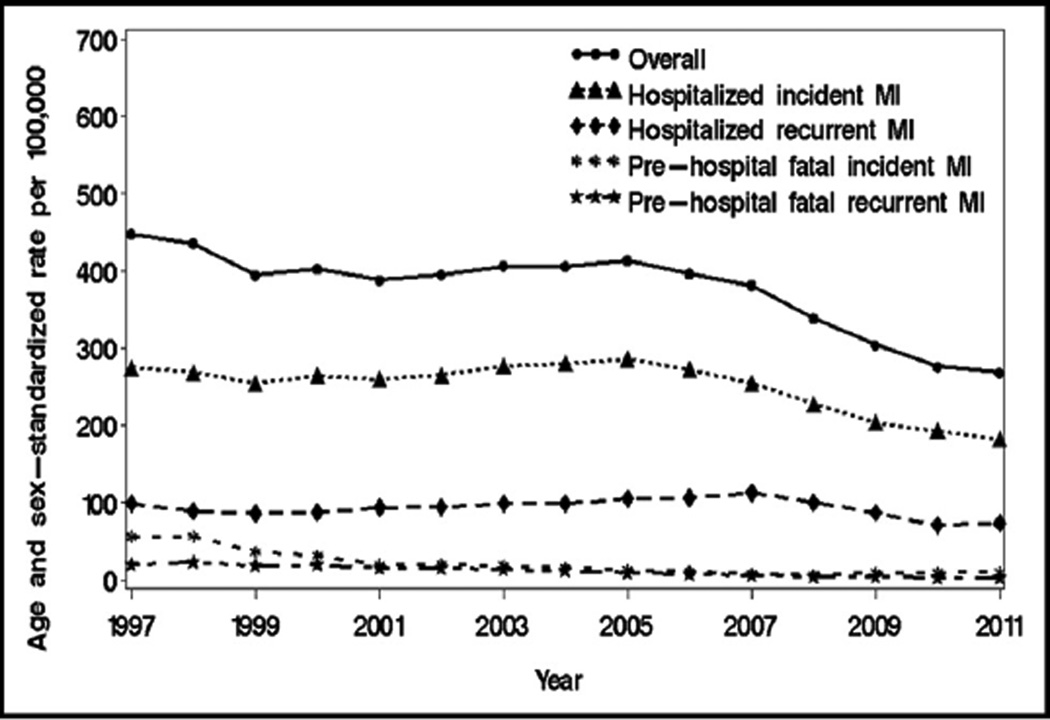
Figure 2.
Temporal trends in myocardial infarction rates. Myocardial infarction rates according to incident/recurrent and hospitalization status in Olmsted County, Minnesota, 1995 to 2012. Yearly rates (smoothed using 3-year moving average) per 100,000 persons have been standardized by the direct method to the age and sex distribution of the US population in 2010. MI = myocardial infarction.

