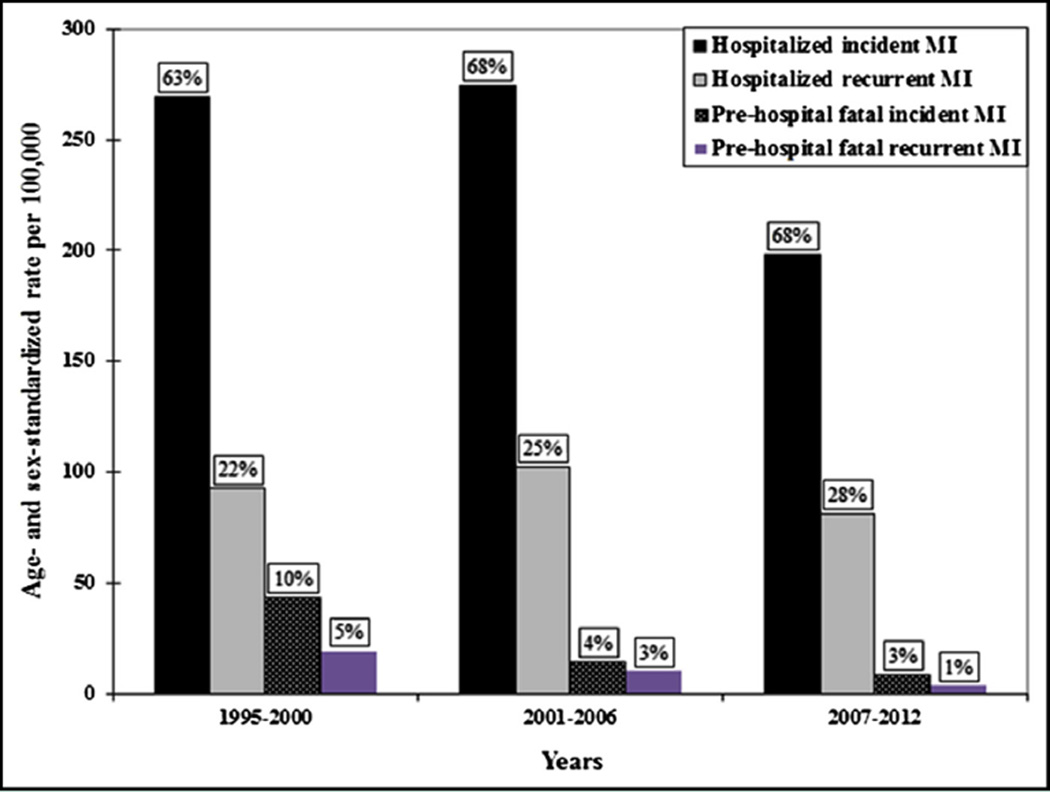
Figure 3.
Changes over time in absolute and relative contribution of myocardial infarction categories to overall rates. Temporal trends in myocardial infarction rates (per 100,000 persons) in Olmsted County, Minnesota, from 1995 to 2012 partitioned into incident/recurrent status and prehospital death/hospitalized myocardial infarction. Rates have been standardized by the direct method to the age and sex distribution of the US population in 2010 and are shown in 6-year intervals. The labels represent the relative percentage of the myocardial infarction categories at each time interval. MI = myocardial infarction.

