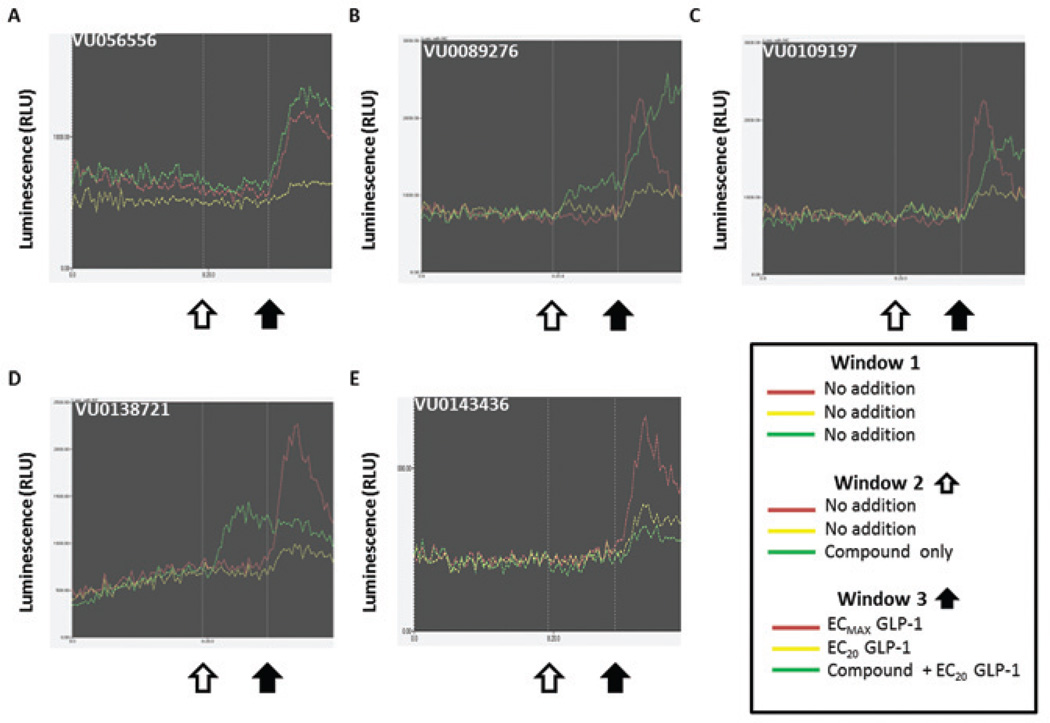
Figure 4.
The luminescent GloSensor™ assays with compound followed by 20% maximal effective concentration (EC20) and ECMAX glucagon-like peptide 1 (GLP-1) reveal potentiators, ago-potentiators, and agonists specific for the GLP-1 receptor (GLP-1R). Each trace represents data from step 4 for the GloSensor™ cAMP assay with GLP-1. Each graph is divided into three panels. There is no addition of compounds or ligand in panel 1. In panel 2, compound was added at the white arrow, and the signal is represented by the green trace (agonist window). In panel 3, EC20 GLP-1 was added at the black arrow to the compound (green trace), along with EC20 GLP-1 (yellow trace) and ECMAX GLP-1 (red trace) for comparison. Potentiation of the cAMP signal over that of the EC20 GLP-1 is visible in (A), (B), (C), and (E), but no potentiation is in (D).

