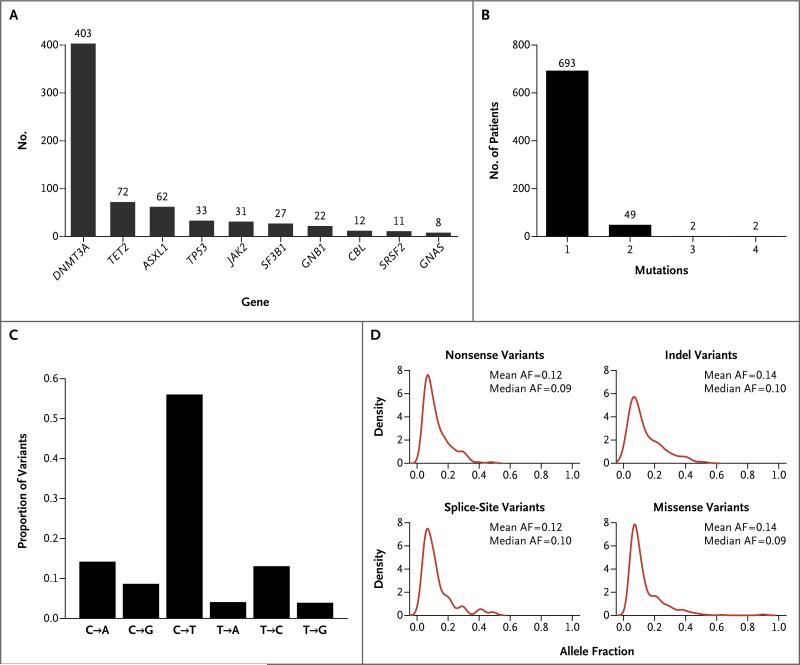
Figure 2. Characteristics of Candidate Somatic Variants.
Panel A shows the 10 most frequently mutated genes implicated in hematologic cancers. Panel B shows the number of persons with 1, 2, 3, or 4 candidate variants. Panel C shows the distribution of the types of single-nucleotide base-pair changes seen in the candidate variants. Panel D shows the allele fractions (AFs) of candidate somatic variants. The allele fraction was calculated as the number of variant reads divided by the number of variant-plus-reference reads. For variants on the X chromosome in men, this number was divided by 2. Indel denotes insertions and deletions.

