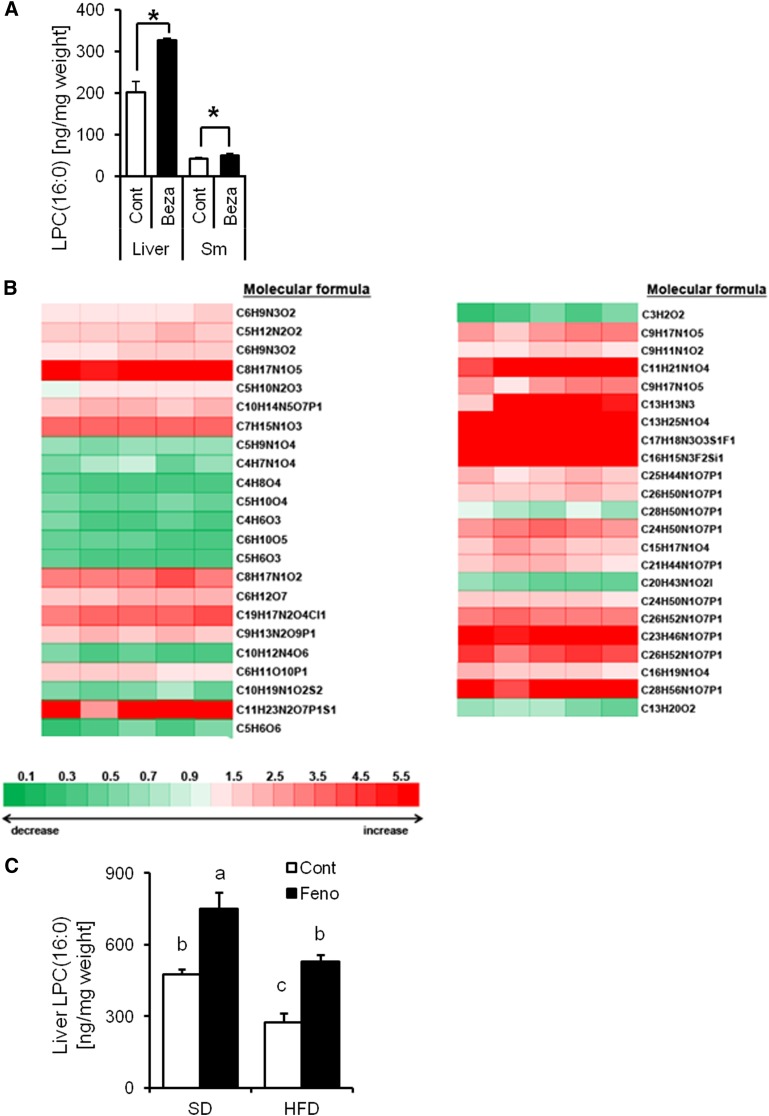
Fig. 2.
Mouse liver induced by PPARα activation produces LPC(16:0). A: Comparative analysis of LPC(16:0) content in mouse liver and skeletal muscle (Sm) treated with or without bezafibrate for 4 weeks (n = 4–7). B: Metabolome analysis of mouse liver treated with bezafibrate for 4 weeks (n = 5). The values are mean fold-change relative to control. C: Comparative analysis of LPC(16:0) content in mouse liver treated with or without fenofibrate for 2 weeks (n = 4). Data are mean ± SEM. * P < 0.05 versus control. Feno; fenofibrate.

