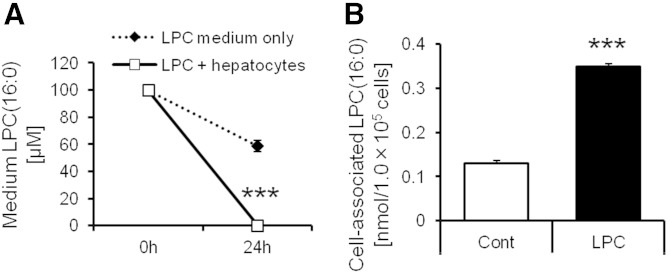
Fig. 7.
The quantification analysis of LPC(16:0) in the medium and cell-associated LPC(16:0) at 24 h after addition of LPC(16:0). A: The concentration of LPC(16:0) in the medium including (black line) or not including hepatocytes (broken line). B: The cell-associated LPC(16:0) treated with or without LPC(16:0). Data are mean ± SEM (n = 6). *** P < 0.001 versus LPC medium only or control.

