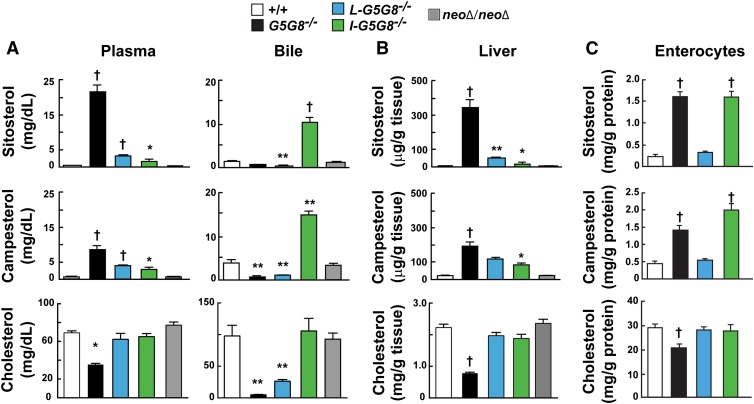
Fig. 2.
Sterol levels in the plasma and gallbladder bile (A), liver (B), and enterocytes (C) of tissue-specific G5G8−/− mice. Tissues and cells were collected as described in the Materials and Methods. Mice in which the Neo cassette had been removed were used as controls (NeoΔ/NeoΔ). Female mice (n = 5/group, 10–12 weeks old) were fed a chow (Diet 7001) for 6 weeks before being euthanized. Tissue sterols were analyzed using GC-MS as described the Materials and Methods. This experiment was repeated three times, and the results were similar. Values are means ± SEMs. All statistical comparisons are to the WT animals. * P < 0.05, ** P < 0.01, and † P < 0.001.

