Fig. 2.
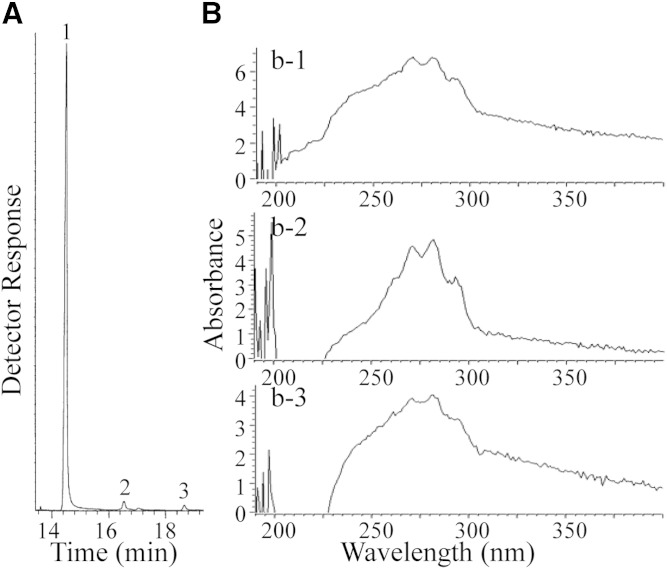
Sterol analysis of BSFs of different origins. A: Representative total ion current chromatogram of neutral lipids from T. brucei BSFs [peak 1, cholesterol; peak 2, campesterol; peak 3, sitosterol cf. (4)]. B: UV spectra of HPLC fraction which had the αc of ergosterol derived by semi-preparative HPLC and analytical HPLC of the neutral lipid fraction of T. brucei brucei (b-1), T. brucei gambiense (b-2), and T. brucei rhodesiense (b-3), as described in text.

