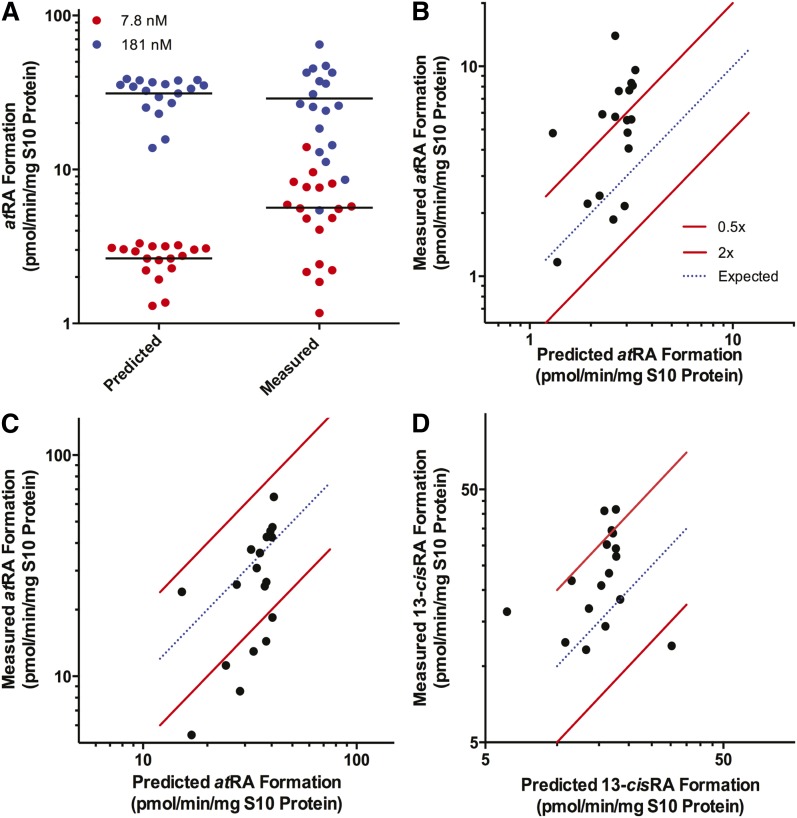
Fig. 3.
Comparison of the predicted and measured ALDH1A activity in human testis. atRA formation was measured and predicted for the 18 subjects with at-retinal as the substrate at free concentrations of 8 nM (red circles) and 181 nM (blue circles) (A). Each dot represents an individual in the study. The measured activity was plotted as a function of predicted activity in each subject with 7.8 nM free at-retinal (B), 181 nM free at-retinal (C), and 600 nM free 13-cis-retinal (D). The blue dotted line represents an exact correlation between predicted and measured RA formation (ALDH1A activity). The red lines represent the range between 2-fold overprediction and 0.5-fold underprediction.

