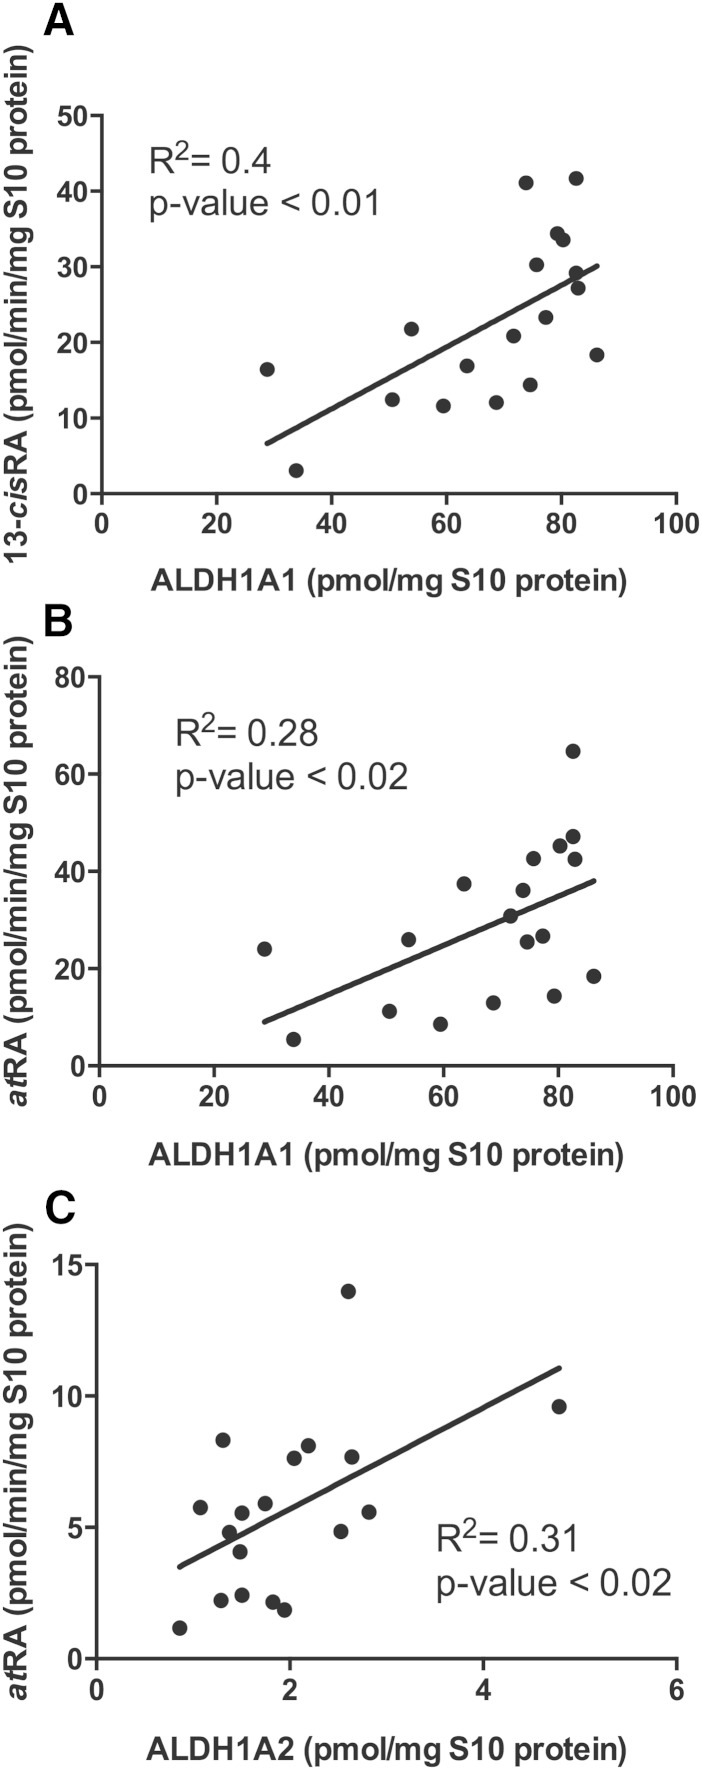
Fig. 5.
The correlation between ALDH1A protein expression and RA formation velocity measured in S10 fraction from testes from each individual in the study. The correlations between 13-cisRA (A) and atRA (B) formation with ALDH1A1 expression are shown with nominal 1,000 nM substrate. The correlation between atRA formation and ALDH1A2 expression at 100 nM nominal substrate concentration is shown in (C).

