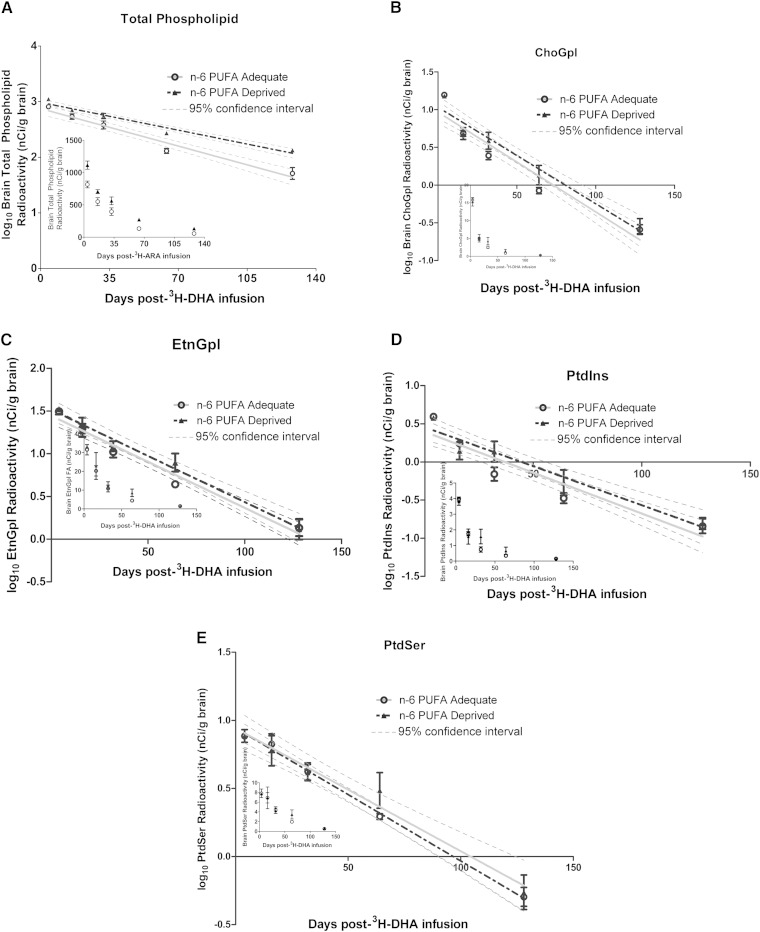
Fig. 4.
Loss of 3H-DHA from brain total phospholipids and fractions over time. Logarithmically transformed curves of the loss of 3H-DHA from brain total phospholipids and fractions over time with linear regression analysis (untransformed curves are inset). A: Total phospholipids. B: ChoGpl. C: EtnGpl. D: PtdIns. E: PtdSer. Data are mean ± SEM (n = 4 independent samples per dietary group per time point). All slopes are significantly different from zero (P < 0.0001).

