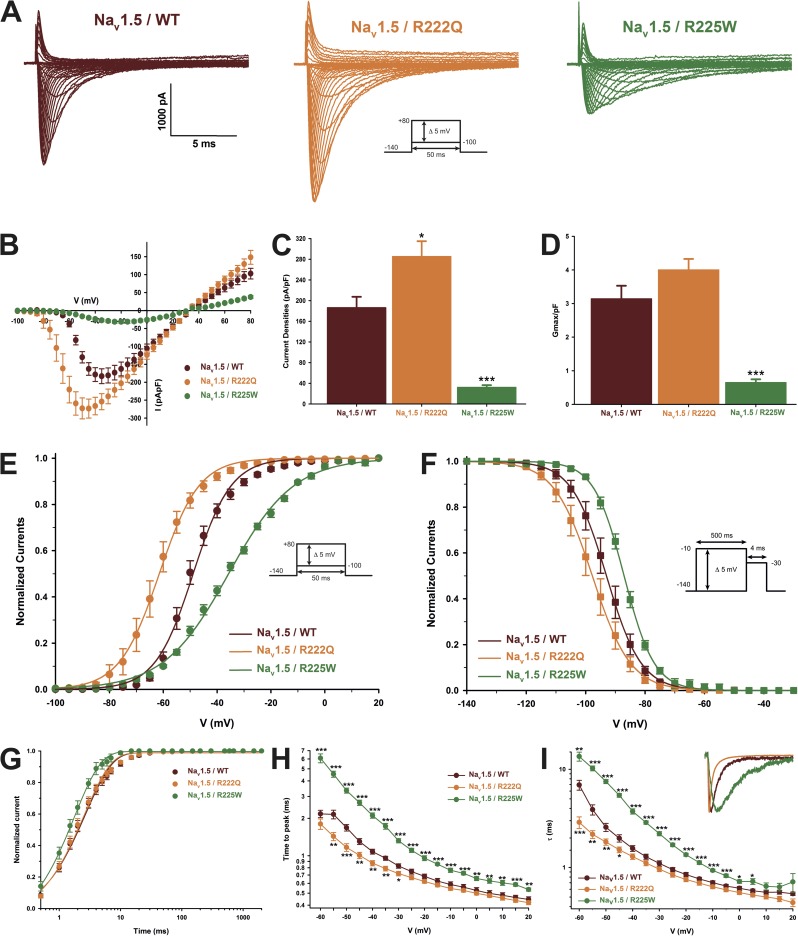
Figure 2.
Biophysical characterization of the Nav1.5 mutant channels. The results for the Nav1.5 WT channel are indicated by red symbols, those for the R222Q mutant channel by orange symbols, and those for the R225W mutant channel by green symbols. (A) Representative whole-cell current traces of the WT and mutant channels. Currents were elicited using a voltage-clamp protocol where depolarizing pulses were applied for 50 ms from −100 to 80 mV in 5-mV increments (see protocol in inset). (B) Current density–voltage (I-V) relationships of the WT and mutant channels. (C) Histogram summarizing the peak current density of the WT and mutant channels. The R222Q channel displayed a higher peak current density than the WT channel (−285.5 ± 29.4 pA/pF, n = 13, and −186.5 ± 21.0 pA/pF, n = 9, respectively). The R225W mutation reduced the peak current density (−32.3 ± 4.2 pA/pF, n = 11). (D) The maximal global conductance (Gmax) of each cell was normalized to the cell membrane capacitance. No differences were observed between the WT (3.1 ± 0.4 pS/pF, n = 9) and R222Q channels (4.0 ± 0.3 pS/pF, n = 13), indicating that there were a similar number of each type of channel on the cell surface. On the other hand, the normalized conductance was significantly lower for the R225W channel (0.6 ± 0.1 pS/pF, n = 11), indicating that there were fewer R225W channels in the cell membrane. (E) Voltage dependence of steady-state activation of the WT and mutant channels. Activation curves were generated using a standard Boltzmann distribution (G(V)/Gmax = 1/(1 + exp(−(V − V1/2)/k))) to give the V1/2 and k values listed in Table 2. (F) Steady-state inactivation of the WT and mutant channels. Inactivation currents were obtained by applying conditioning prepulses to membrane potentials ranging from a holding potential of −140 to −10 mV for 500 ms in 5-mV increments and were then measured using a 4-ms pulse to −30 mV at each step (see protocol in inset). The recorded inactivation values were fitted to a standard Boltzmann equation (I(V)/Imax = 1/(1 + exp((V − V1/2)/k)) + C) to give the values listed in Table 1. (G) Recovery from fast inactivation was obtained using a two-pulse protocol at 30 mV to obtain maximal activation (see protocol in inset). The time constants listed in Table 1 were obtained using a two-exponential function: (Afast(1 − exp(−t/τfast)) + Aslow(1 − exp(−t/τslow)) + C). (H) The times to peak of the WT and mutant channels were used to evaluate the activation kinetics. The times to peak were measured on the same current traces used to construct the I-V relationship. (I) The time constants of fast inactivation decay were plotted as a function of voltage for the WT and mutant channels. The time constants were obtained using a simple-exponential function: (Afast(exp(−t/τ) + C). Normalized raw data shown in the inset illustrate the current decay kinetics. Data are expressed as means ± SEM. Differences were considered significant at P < 0.05 (*), < 0.01 (**), or < 0.001 (***).

