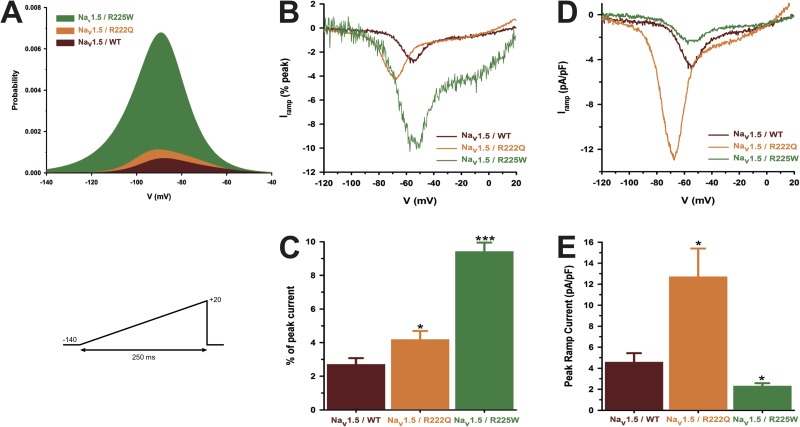
Figure 3.
Window currents of the Nav1.5 WT and mutant channels. (A) The overlap between activation and inactivation defines the window current. The predicted window current was obtained using the following equation: (1/(1 + exp((V1/2activation − V)/kactivation))((1 − C)/(1 + exp((V − V1/2inactivation)/kinactivation)) + C). The presence of the mutation increased the predicted window current over 2.3-fold. (B–E) Ramp protocols (see protocol in inset) were imposed (0.64 mV/ms) to study the window current. As predicted in A, the window currents of the mutant channels were higher than that of the WT channel. (B) Ramp current traces normalized to the α peak current. (C) Histogram showing the peak window current normalized to the α peak current (% of peak current). (D) Average traces of ramp currents normalized to cell capacitance to study ramp current density. (E) Peak ramp current density (pA/pF). Data are expressed as means ± SEM. Differences were considered significant at P < 0.05 (*) or < 0.001 (***).

