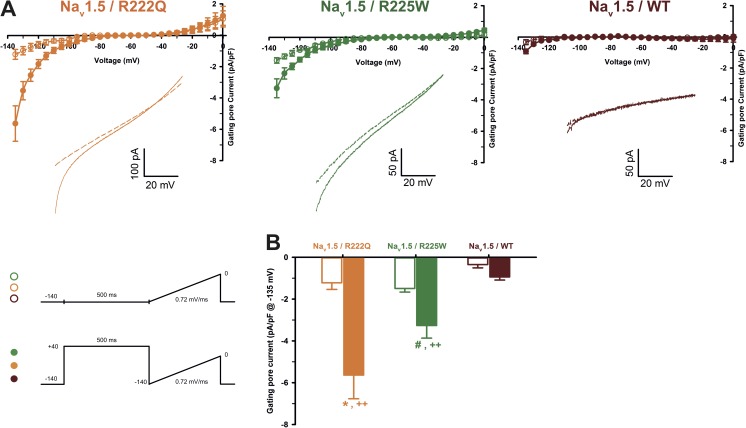
Figure 6.
Gating pore current after long depolarizations. (A) Current generated by ramp pulses (see protocols in inset), for R222Q (left), R225W (middle), and WT (right) channels (using solutions 1 and 5 listed in Table 1). The I-V curves were constructed by averaging values of current at each 5 mV. The voltage was calculated using the known time course of the ramp protocol. Thus, for purpose of clarity, the plotted points (mean ± SEM) do not represent steady-state currents, but they represent average current every 5 mV. The linear leak subtraction around −75 to −45 mV was performed to eliminate inherent linear leak. The insets show the currents in response to ramp protocols. Dashed lines indicate the current obtained without 500-ms predepolarization. Solid lines indicate the response after 500-ms predepolarization. (B) Histogram summarizing the inward gating pore current density at −135 mV recorded with or without 500-ms predepolarization. R222Q and R225W exhibit gating pore currents when compared with control ramp protocols without predepolarization (−5.6 ± 1.1 pA/pF, n = 5, for R222Q [*], and −3.3 ± 0.6, n = 3, for R225W [#]). ++, statistical difference between mutant and WT condition (P < 0.01). Data are expressed as means ± SEM. Differences were considered significant at P < 0.05 (*, #) or < 0.01 (++).

