Figure 7.
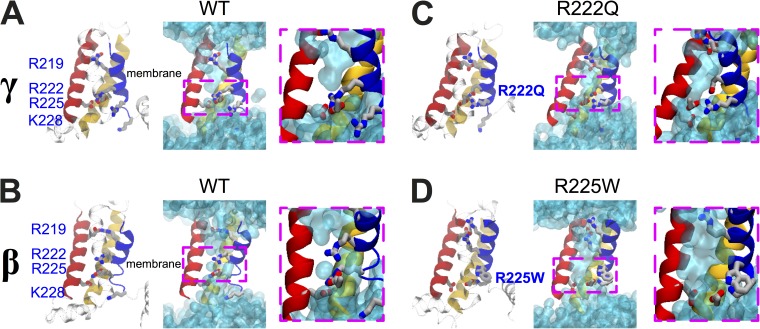
Structural models of the DI VSDs of the Nav1.5 WT, R222Q, and R225W mutants. Structural models of the relaxed DI VSD of the WT in the γ (A) and β (B) states. (C) Structural model of the relaxed DI VSD of the R222Q mutant in the γ state. (D) Structural model of the relaxed DI VSD of the R225W mutant in the β state. For all the structural models, the VSD protein backbone is represented as a ribbon (left panel, S1 in yellow, S2 in red, S3 in transparent cyan, and S4 in blue). The gating charges of S4 and the counter charges of S2 and S3 are shown as sticks (carbon in gray, nitrogen in blue, and oxygen in red; hydrogens are omitted for clarity). In the middle panel, the water-accessible volume is shown as a transparent cyan surface. For each configuration, a higher magnification of the GCTC (dotted pink box) is shown.

