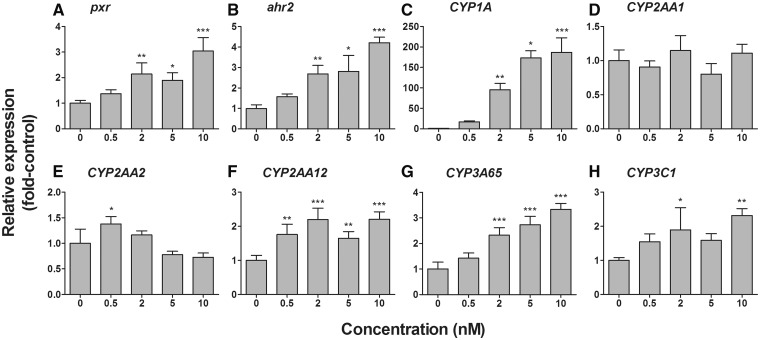
FIG. 4.
Dose-response relationships for effects of PCB126 on the mRNA expression of pxr (A), ahr2 (B), CYP1A (C), CYP2AA1 (D), CYP2AA2 (E), CYP2AA12 (F), CYP3A65 (G), and CYP3C1 (H) in developing zebrafish (determined at 96 hpf). Embryos were exposed to carrier (0.02% DMSO) or differing concentrations of PCB126 (0.5, 2, 5, or 10 nM) for 24 h starting at 24 hpf. At 96 hpf, eleutheroembryos were sampled for quantitative real-time PCR analysis. Relative expression (fold-control) was calculated by E−ΔΔCt using ef1α as a reference gene (Jonsson et al., 2007, 2012). Other conditions are the same as given in the legend of Figure 2.

