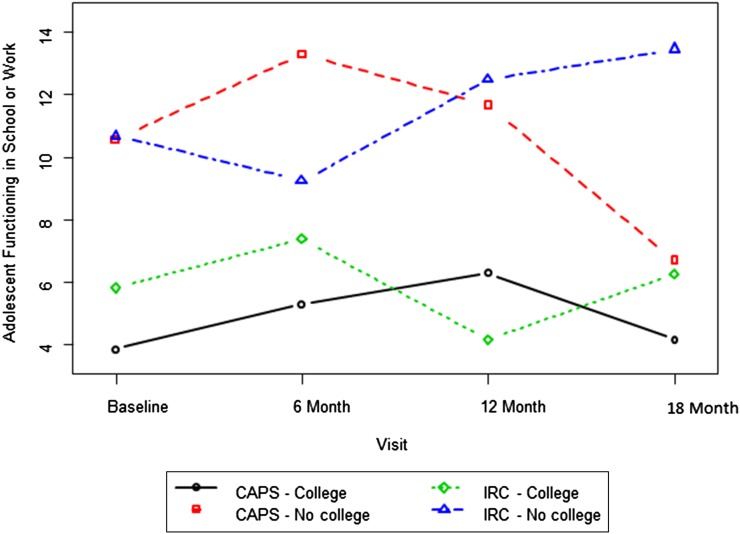
FIGURE 3.
Ratings of functioning at school or work over time by group and primary caregiver education. There was a significant group × time × caregiver education interaction, F(3, 315) = 3.26, P = .02. Post hoc contrasts indicate a significant group difference between the low-education CAPS and IRC groups at visit 4: t(351) = −2.20, P = .03.

